
1. So far, all this correction has done is remove the excessive (parabolic) January gains.
Source: Thechartstore.com; As of 2/12/18
2. We are still in the middle of a long term trend channel.

Source: Thechartstore.com; As of 2/6/18
3. Some longer term perspective on market volatility.
Source: Topdown Charts; As of 2/12/18
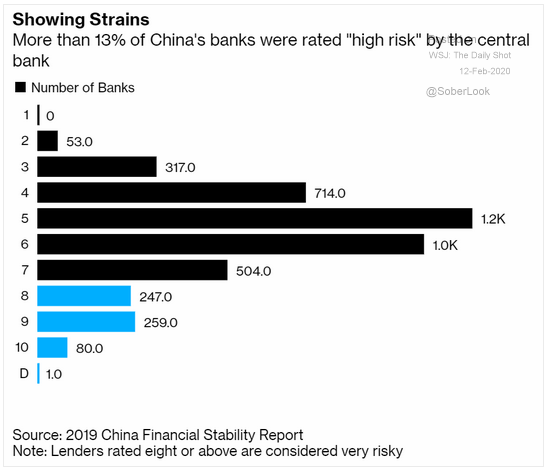
4. The USD is a safe haven in volatile markets. Which trend will continue?
Source: Thechartstore.com; As of 2/9/18
5. Another blow to diversification providing portfolio defense. When markets fail, risk assets correlate towards 1!

Source: Thechartstore.com; As of 2/9/18
6. After all the volatility and price swings...where we stand today.

Source: Thechartstore.com; As of 2/9/18
7. Yields are up across the curve.

Source: Thechartstore.com; As of 2/9/18
8. Has the canary stopped singing? We are watching closely!

Source: Thechartstore.com; As of 2/9/18
9. Even the modest start to the Fed unwinding QE is helping rates rise.
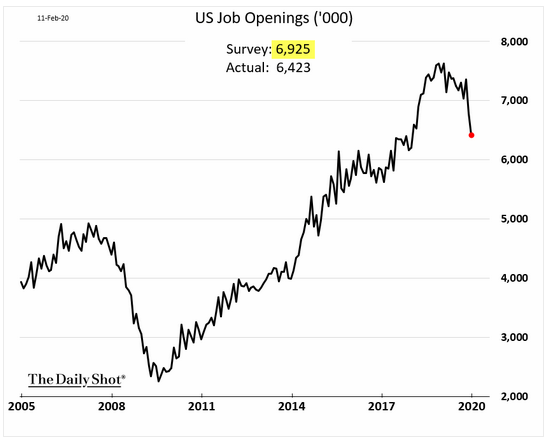
Source: WSJ Daily Shot; As of 2/7/18
10. Another trend weighing on investor's minds.

Source: Thechartstore.com; As of 1/18
11. While these are only projections it outlines what many are worried about....
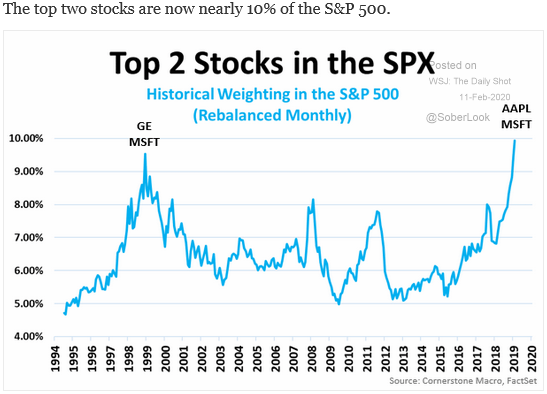
Source: WSJ Daily Shot; As of 2/12/18
12. Perspective on how quickly rising rates work their way into the economy.
Source: WSJ Daily Shot; As of 2/12/18
13. These are the types of headlines that will pressure the Fed into making a policy mistake.

Source: Bloomberg; As of 2/12/18


