Happy Thanksgiving week, Fireside Charts readers! The 10-year treasury yield hit a three-year low in early September (and has been lingering below 2% ever since) but a look back through 2012 has us wondering if it could be poised to rise. Meanwhile, the high-yield bond spread has already established some upward momentum as investors begin to demand more reward for taking on risk—can you guess how much the spread has jumped since the lows of 2017? And whose government-bond shopping spree could put black Friday to shame? Turning to sectors, while Energy is still disappointing, Financials are cruising toward their January '18 high. Could they soon top the record print? Finally, does the approaching close of the 2010's have the markets feeling nostalgic for bygone eras? Our focus may be on Thanksgiving this week, but market capitalization is outpacing nominal GDP like it's New Year's '99...
1. Are interest rates basing for a leg higher?
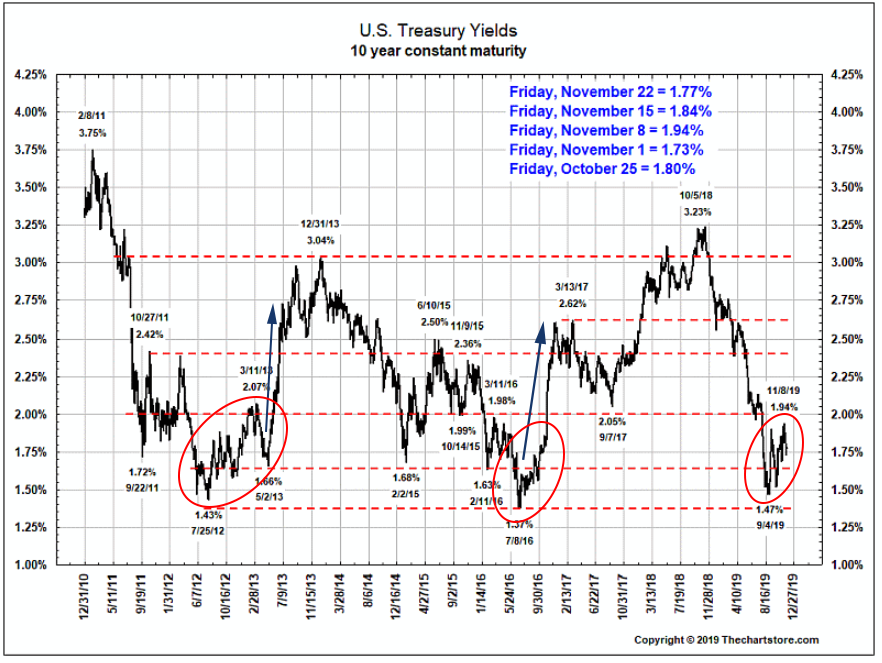
Source: The Chart Store, as of 11/22/19
2. High Yield seems to be demanding a full percent more spread than during the "uber-calm" of 2017-early 2018.
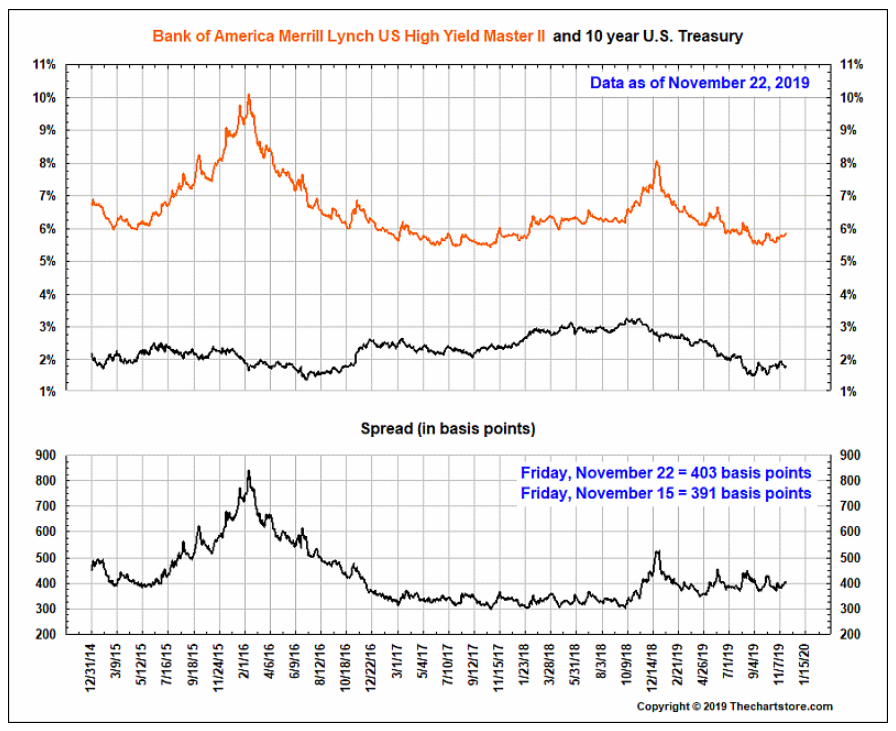
Source: The Chart Store, as of 11/22/19
3. Yet the lower credits are flashing a warning signal...
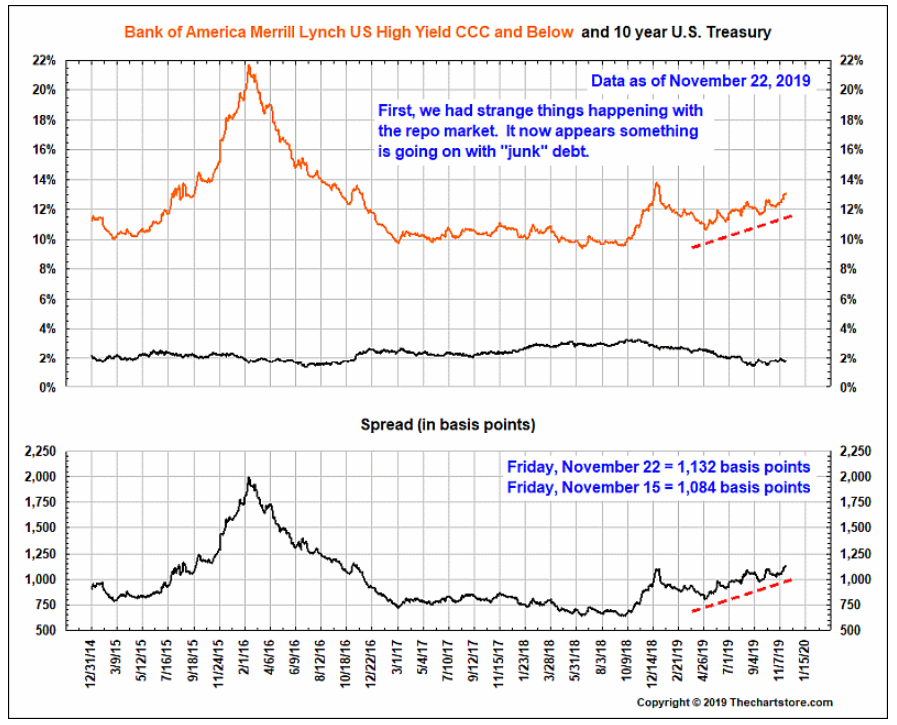
Source: The Chart Store, as of 11/22/19
4. Someone has to buy our Government's debt!
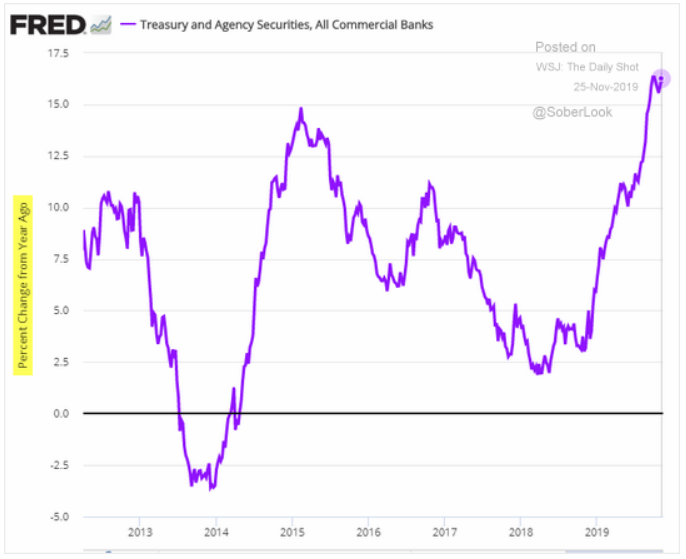
Source: FRED from 11/25/19
5. For all the jawboning going on in the energy markets, the energy sector is still in a rut...
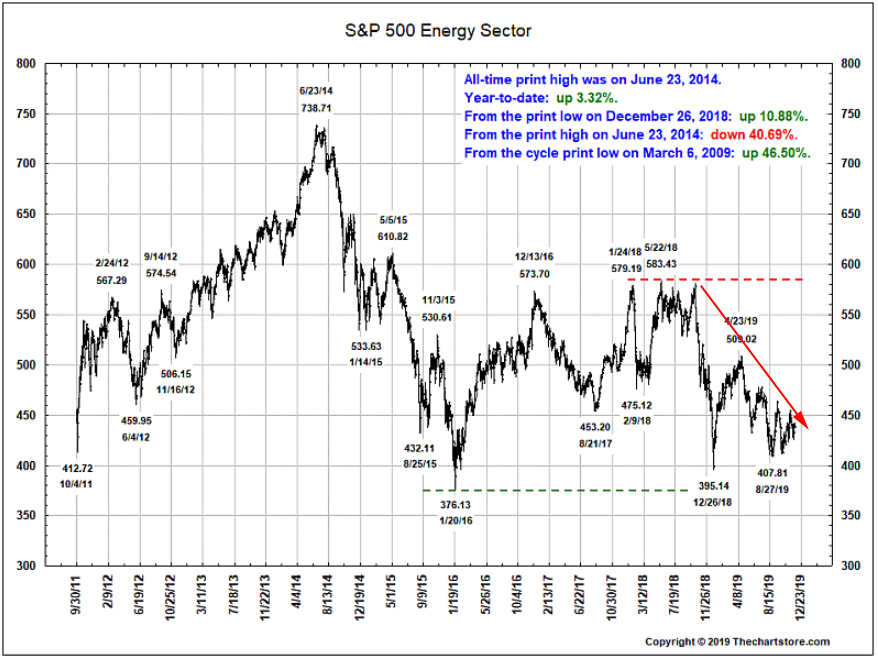
Source: The Chart Store, as of 11/22/19
6. Will the Financials Sector finally break through resistance?
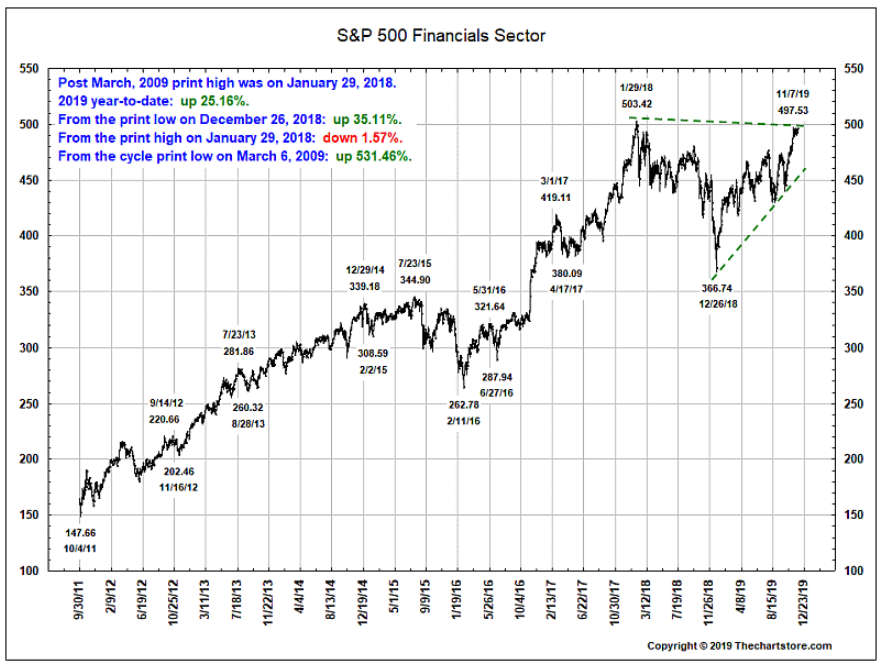
Source: The Chart Store, as of 11/22/19
7. The markets do "feel" a bit like 1998/99...
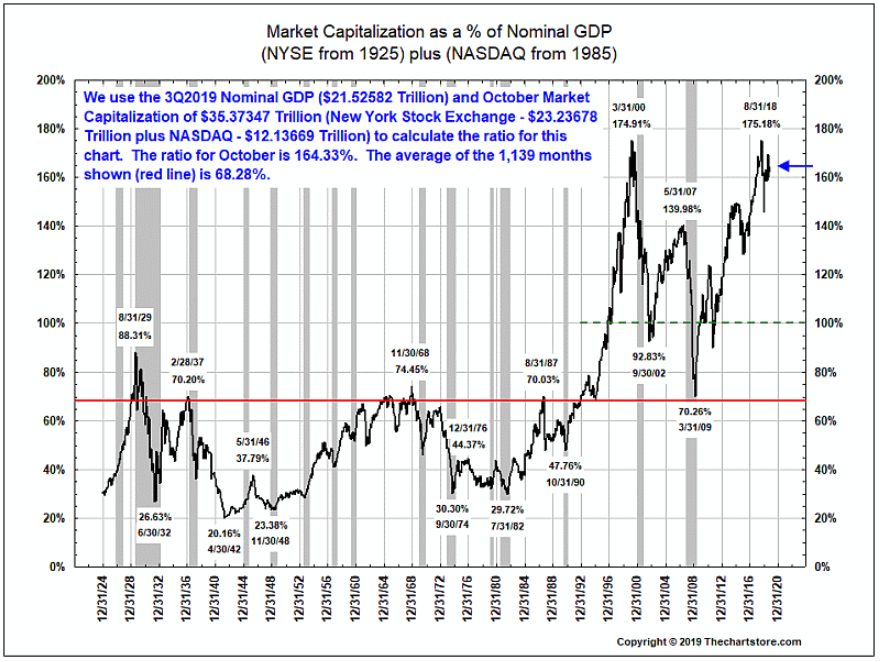
Source: The Chart Store, as of 11/22/19
8. Did the 19.7% drawdown in 4Q18 (which went over 20% intraday) count as a correction and reset the growth clock?
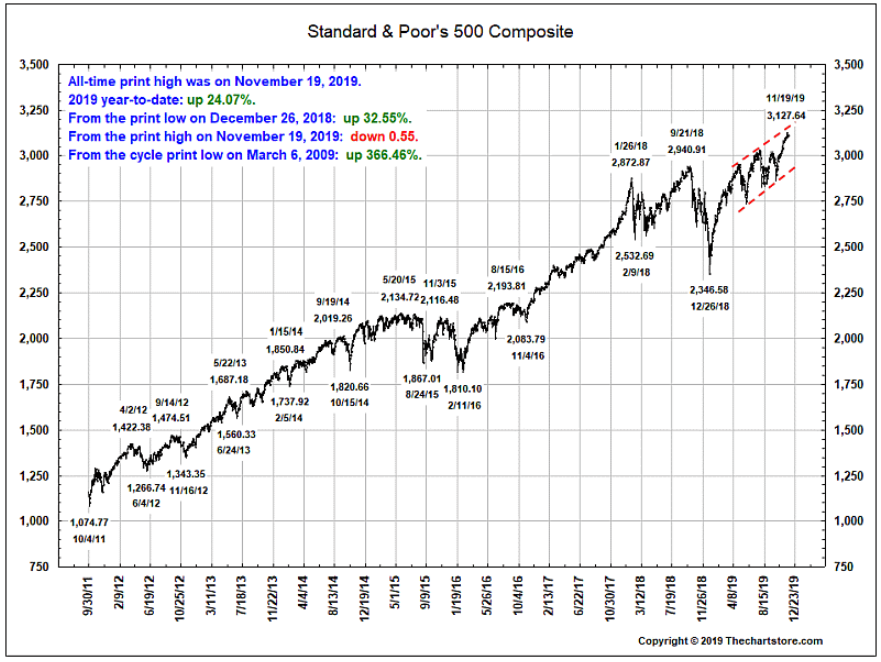
Source: The Chart Store, as of 11/22/19
9. Still contracting...
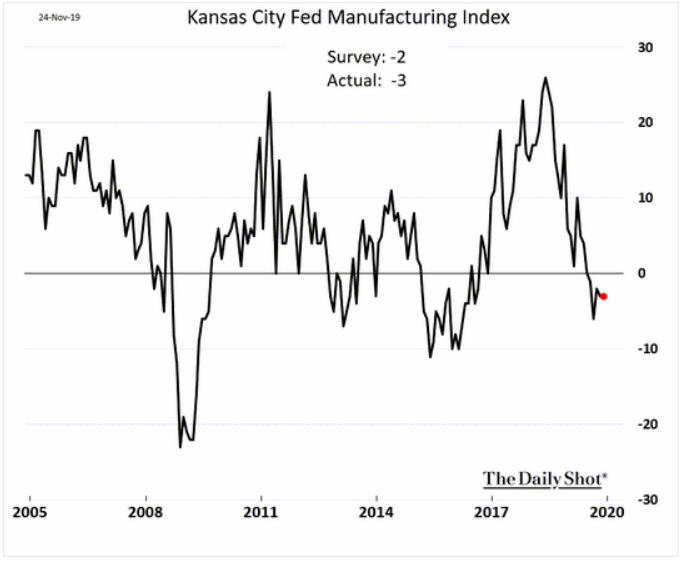
Source: WSJ Daily Shot, from of 11/24/19
It's a short week and we know you've got plenty of reading to do before heading out on vacation, so why not make life a little easier and watch a video instead? Click below to watch some quick, two-minute video summaries of BCM, our investing philosophy, and our strategies.

Disclosure: The charts and info-graphics contained in this blog are typically based on data obtained from 3rd parties and are believed to be accurate. The commentary included is the opinion of the author and subject to change at any time. Any reference to specific securities or investments are for illustrative purposes only and are not intended as investment advice nor are a recommendation to take any action. Individual securities mentioned may be held in client accounts.