Remember this? It’s late in 2007 and the banks have already started their downward spiral. As their prices fell, their dividend yields rose. Most “high yielding,” “high dividend” or “dividend achiever” type ETFs/funds rebalance quarterly, so at year end, what did they do? They loaded up on bank stocks.
The bank stocks, as we now know, continued to fall and eventually cut or eliminated their dividends, forcing a sale from these types of ETFs/funds at or near the low—and the ETFs/funds suffered accordingly.
Many investors buy these funds expecting a relatively safe and stable yield. Do you own a fund or ETF that fits this description today? If so, caveat emptor! It’s important to understand how the dividend investment (ETF or mutual fund) selects the companies it invests in. A high dividend yield can indicate a company is having problems—just like in the 2007 example above.
As the chart below shows, many companies are projected to, or already have, cut or eliminated their dividend. The “catch a falling knife” scenario is going to happen again, or perhaps it just did at the end of the first quarter. In fact, it could be even worse than 2007. Just a few months ago, many quality companies in industries such as hotels, travel, entertainment, restaurants, and manufacturing were great dividend payers. Did your dividend-oriented ETF/fund just load up on struggling companies that are being decimated by the Covid-19 fallout? You might want to find out!
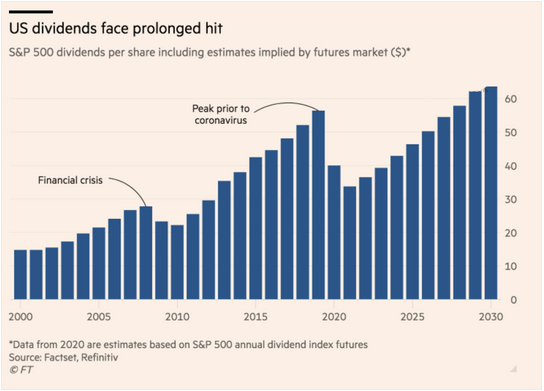
Source:: The Financial Times, from 4/6/20
In today’s world of ultra-low to negative interest rates, many investors are turning to stock dividends to create portfolio income to live off of. If your objective is to buy high quality, high yielding companies and not simply buy companies with the highest yield outright—which often times are risky businesses—then make sure you understand exactly how your dividend ETFs are composed. The objective is to own companies that are growing their yield and/or have paid their dividend consistently for many years, not to buy companies with high yields due to falling price. Funds/ETFs with a robust set of quality screens can help to mitigate this risk. One such example is O’Shares FTSE U.S. Quality Dividend ETF (OUSA), which we have used ourselves to accomplish this goal.
One way to evaluate this is looking at the Beta of sample Dividend ETFs. For example, in the chart below you can see the broad-based increase in “Beta” for two of the largest AUM Dividend ETFs compared to O’Shares’ OUSA below. As the coronavirus crisis began to unfold in March, each ETF’s sensitivity to the market increased, but the constraints and screens used by OUSA to avoid concentration and lower quality companies has resulted in lower risk during a time of extreme market strain.

Source: Koyfin; Beaumont Capital Management (BCM). Data is for the period 12/19/2019 through 4/20/2020. See disclosures for more information on each ETF represented in the chart. Past performance is no guarantee of future results.
A version of the process used by OUSA was developed for Kevin O’Leary (Mr. Wonderful from Shark Tank) back when he sold his prior company and began managing his family trust. Stable, quality income was a major goal. OUSA is designed to invest in large and mid-capitalization, dividend-paying issuers in the United States that meet certain market capitalization, liquidity, high quality, low volatility and dividend-yield thresholds. The high quality and low volatility requirements are designed to reduce exposure to high-dividend equities which have simply experienced large price declines and may be at risk to pay their dividends consistently.
We have no monetary incentive in or for O’Shares other than investing in OUSA. Please do your own research, but this is another sleepy “gotcha” that is worth pointing out. Good luck!
For more insights like these, subscribe to BCM’s blog at blog.investbcm.com.

Disclosures:
Copyright © 2020 Beaumont Capital Management (BCM). All rights reserved.
The views and opinions expressed throughout this presentation are those of the author as of April 23rd, 2020. The opinions and outlooks may change over time with changing market conditions or other relevant variables.
This material is provided for informational purposes only and does not in any sense constitute a solicitation or offer for the purchase or sale of a specific security or other investment options, nor does it constitute investment advice for any person. References to specific securities are for illustrative purposes only and are not a recommendation to take any action. OUSA is currently held in one or more of the BCM strategies.
The information presented in this report is based on data obtained from third party sources. Although it is believed to be accurate, no representation or warranty is made as to its accuracy or completeness.
Chart titled “High Dividend ETF Betas Over Time”: “Dividend ETF ‘A’” is represented by Vanguard High Dividend Yield ETF (VYM) which is the largest U.S. Dividend ETF by AUM. “Dividend ETF ‘B’” is iShares Select Dividend ETF (DVY).
As with all investments, there are associated inherent risks including loss of principal. Stock markets, especially foreign markets, are volatile and can decline significantly in response to adverse issuer, political, regulatory, market, or economic developments. Sector and factor investments concentrate in a particular industry or investment attribute, and the investments’ performance could depend heavily on the performance of that industry or attribute and be more volatile than the performance of less concentrated investment options and the market as a whole. Securities of companies with smaller market capitalizations tend to be more volatile and less liquid than larger company stocks. Foreign markets, particularly emerging markets, can be more volatile than U.S. markets due to increased political, regulatory, social or economic uncertainties. Fixed Income investments have exposure to credit, interest rate, market, and inflation risk. Diversification does not ensure a profit or guarantee against a loss.
Past performance is no guarantee of future results. ETF performance shown is gross of fees and expenses. An investment cannot be made directly in an index. Individual securities mentioned may be held in client accounts. Index performance is gross.
Beta is a measure of the volatility, or systematic risk, of a security or portfolio, in comparison to the market as a whole. Beta describes the activity of a security's returns responding to swings in the market. The beta calculation is used to help investors understand whether a stock moves in the same direction as the rest of the market, and how volatile (risky) it is compared to the market.
All BCM strategies invest solely in long-only ETFs.