Earnings season kicks off this week and analysts' expected EPS growth in the MSCI USA index is currently at 10%+ through 2021. Strong growth from tech firms is also helping boost the Nasdaq Composite Index, which just saw its market value climb to over half of that of the S&P 500. Over in the bond market, 10-year U.S. Treasury (UST) yields look to be revisiting patterns from 2012 and 2016; could they be poised to rise after hovering near historic lows for much of the last year? Finally, it's resolution season out there—can BCM help you tackle 2020's most popular?
1. Will the trade truce allow companies to grow their earnings enough to keep up with expectations?
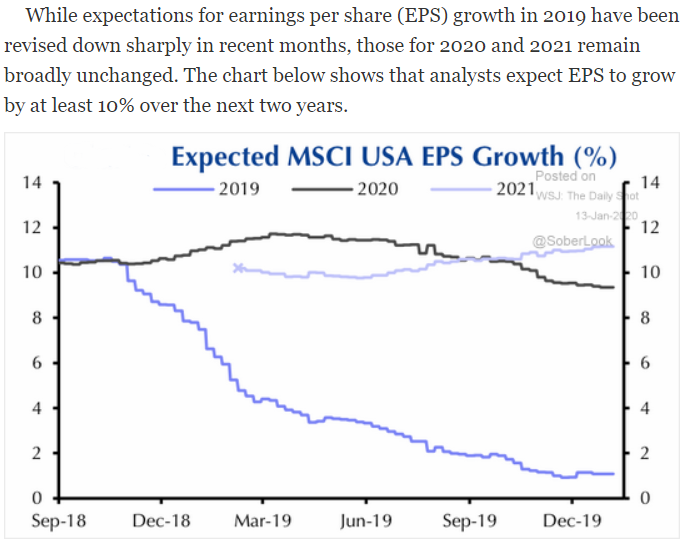
Source: WSJ Daily Shot, from 1/13/20
2. The tech heavy NASDAQ has grown to over 1/2 the market cap of the S&P 500...
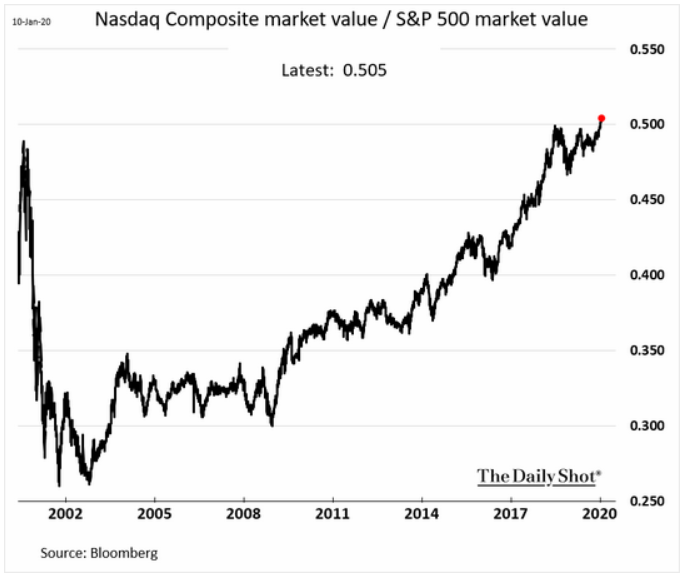
Source: WSJ Daily Shot, from 1/13/20
3. Similar to U.S. Small Caps, the DOW Transports have yet to reclaim their 2018 highs...
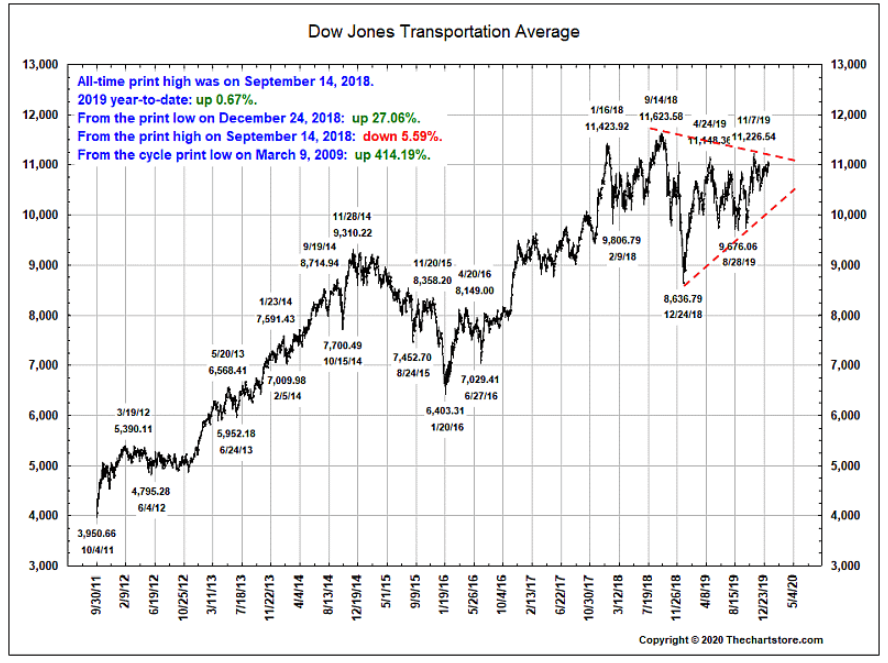
Source: The Chart Store, as of 1/10/20
4. Are interest rates basing before a new leg up?
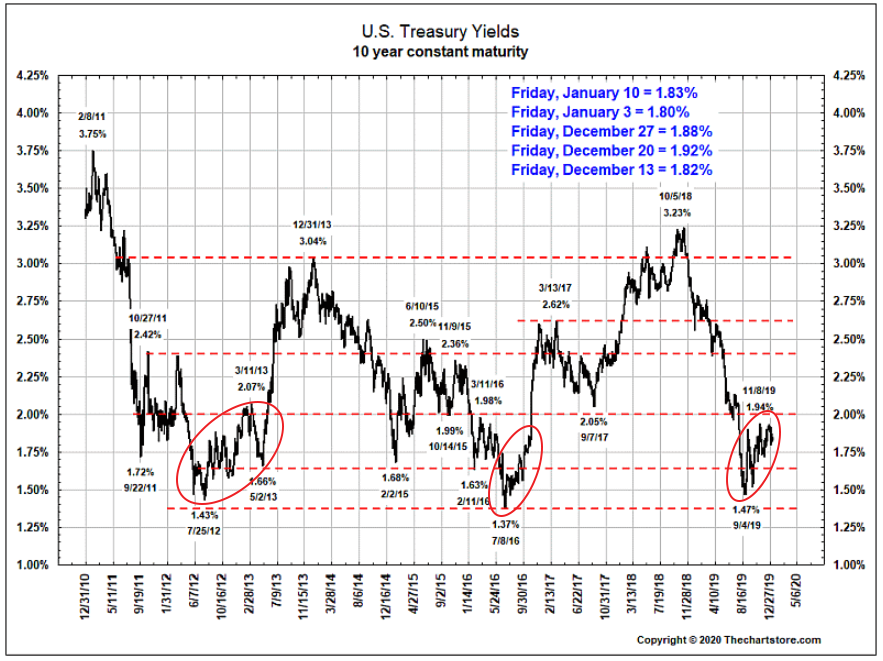
Source: The Chart Store, as of 1/10/20
5. Junk bond yields have fallen below the lows of 2017...
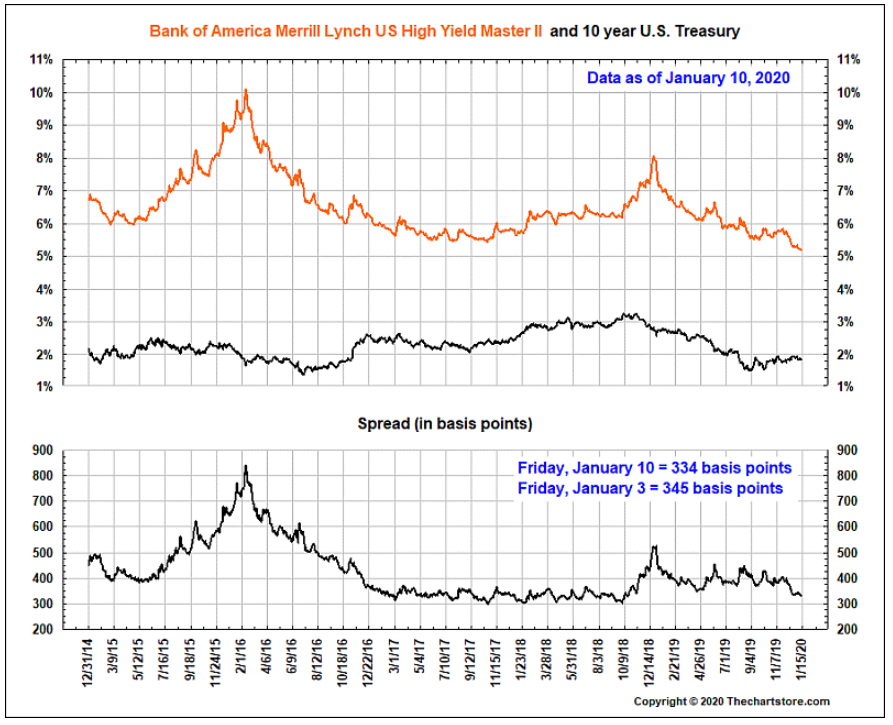
Source: The Chart Store, as of 1/10/20
6. We've got a few ideas on #1!

Source: Statista, from 12/16/19
Information is power, and we're packing a lot of it into our Q4 market commentary coming tomorrow. Are you subscribed to our blog for daily or weekly notifications? If not, sign up below so you don't miss out on what the BCM Investment Team has to say about Q4, the state of our global economy, and other market areas to watch.

Disclosure: The charts and info-graphics contained in this blog are typically based on data obtained from 3rd parties and are believed to be accurate. The commentary included is the opinion of the author and subject to change at any time. Any reference to specific securities or investments are for illustrative purposes only and are not intended as investment advice nor are a recommendation to take any action. Individual securities mentioned may be held in client accounts.