Last week’s policy shift from the Fed brings uncertainty about the future of inflation, which has lingered below the Fed’s 2% target since 2012. Weak inflation is partially attributable to a dramatic decrease to the velocity of money, which has only slowed further since the onset of the Covid-19 crisis. Meanwhile, the manufacturing recovery continues as the sector closes out its third consecutive month of expansion, though increased production has not yet sparked a commensurate rise in hiring. Finally, we’re keeping an eye on EM, global markets, and the beleaguered U.S. agricultural sector, where the sinking USD could potentially spark some long-awaited movement.
1. Long-term inflation expectations continue to creep higher. The new Fed policy of 2% average inflation means that the Fed will allow higher than 2% inflation to "make up" for years of sub-2% inflation. With trillions of new debt and record federal deficits, will this scenario allow inflation to overheat? Sorry, I’m a child of the 1970’s…

Source: The Daily Shot, from 9/1/20
2. One culprit to the low inflation is the velocity of money, or the rate and speed money is exchanged in the economy. The M2 velocity is currently 1/2 the rate of the 1990's...
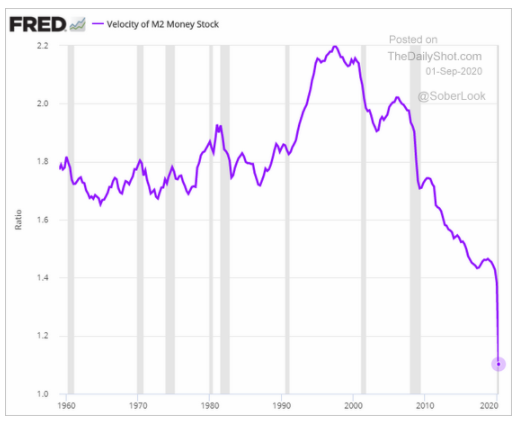
Source: The Daily Shot, from 9/1/20
3. Is this encouraging print due to pent up demand or is the housing rally and other economic activity really on track?

Source: The Daily Shot, from 9/2/20
4. Another regional Fed report showing "all is well"...
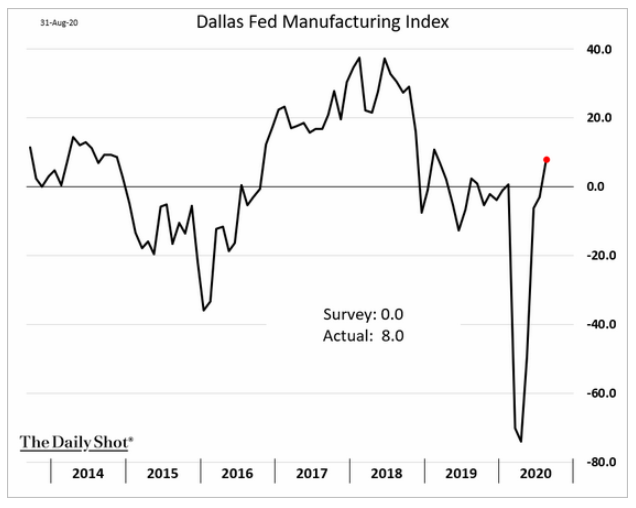
Source: The Daily Shot, from 9/2/20
5. Manufacturing employers are taking a cautious approach...
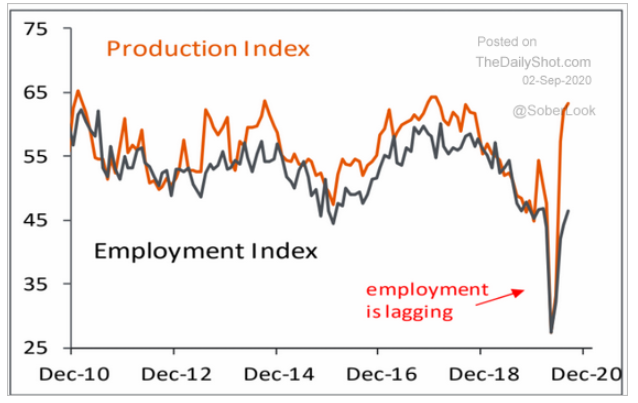
Source: The Daily Shot, from 9/2/20
6. Depending on the industry, some jobs are just going to be lost...

Source: The Daily Shot, from 9/2/20
7. The markets continue with the "one-man band"...

Source: The Daily Shot, from 9/2/20
8. Will the US Dollar's decline finally give EM and DM markets a long-awaited tail wind?

Source: Haver Analytics, Federal Reserve Board, Goldman Sachs, from 9/1/20
9. Will the weaker dollar finally give U.S. farmers a break?

Source: The Daily Shot, from 9/2/20
10. Europe's CPI has turned back to deflation...
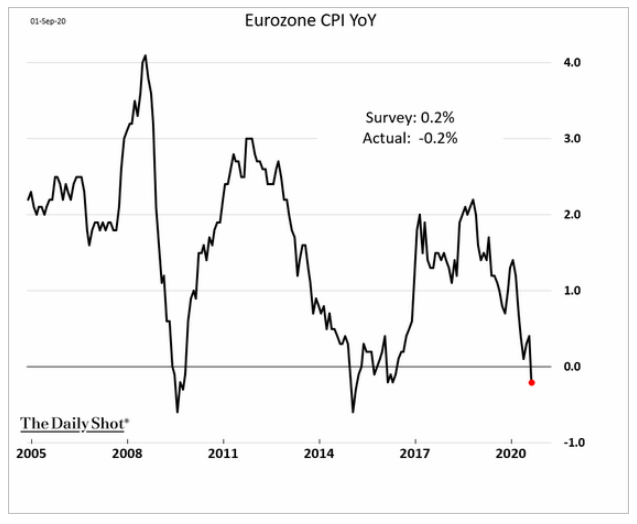
Source: The Daily Shot, from 9/2/20
11. Inflation is muted in Europe and some other major economies. Imported inflation does not seem to be a current issue

Source: Eurostat, Bloomberg Survey of Economics, as of 7/31/20
12. This year the federal government is going to create new debt of almost $12,000 for every man, woman and child in the U.S.

Source: Manhattan Institute, as of 1/2020
Do you know someone that could benefit from our chart blog? For one, being a better investor is all about education. For weekly perspectives on dozens of market and economic charts, share the link to sign up for the Bird's Eye View Blog for a friend, colleague, or anyone that may take advantage!

Disclosure: The charts and info-graphics contained in this blog are typically based on data obtained from 3rd parties and are believed to be accurate. The commentary included is the opinion of the author and subject to change at any time. Any reference to specific securities or investments are for illustrative purposes only and are not intended as investment advice nor are a recommendation to take any action. Individual securities mentioned may be held in client accounts.