Happy Thanksgiving Eve! We know you're anxious to get to your vacations, so we'll keep it to bullet points today:
- Despite numerous headlines on IPOs this year, the number of U.S. listed stocks has nearly halved in the past ~25 years. Is increasing variety of investment vehicles to thank?
- The Chicago Fed's National Activity Index (a weighted average of 85 existing monthly indicators of national economic activity) dipped further into negative territory this month, as did the Dallas Fed Manufacturing Index.
- The amount of dollar-denominated debt sold by Chinese issuers has approximately doubled since 2014 to set a record this year. Can you guess 2019's total?
Have a wonderful holiday and we'll see you next week!
1. While there are ~1,200 U.S. stock ETFs and almost 4,000 U.S. stock mutual funds, there are only about 3,500 U.S. stocks listed on major exchanges!
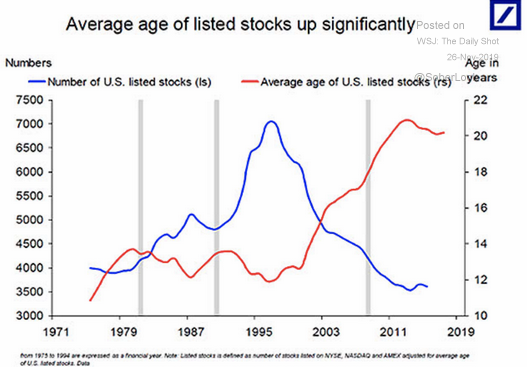
Source: WSJ Daily Shot, from 11/26/19
2. Some updates to the Regional Fed Surveys:
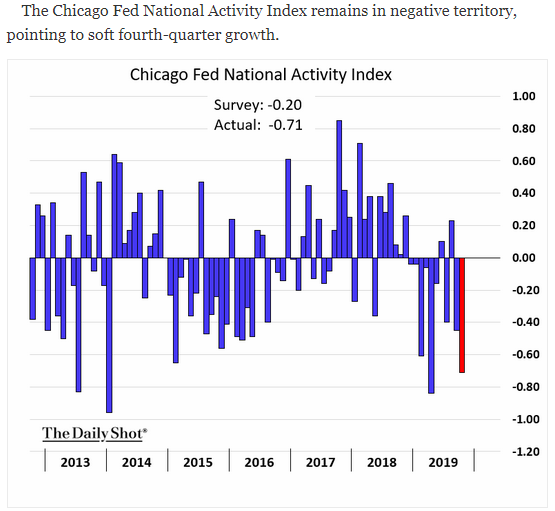
Source: WSJ Daily Shot, form 11/26/19
3. And Dallas:
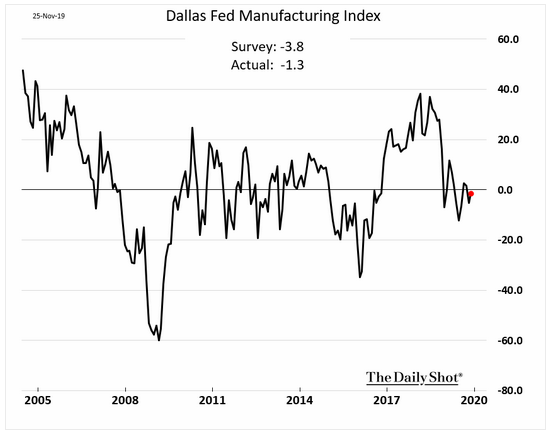
Source: WSJ Daily Shot, from 11/26/19
4. If U.S. oil and gas production is at record highs with ~1,500 wells, what would happen if 4 times that got turned on?
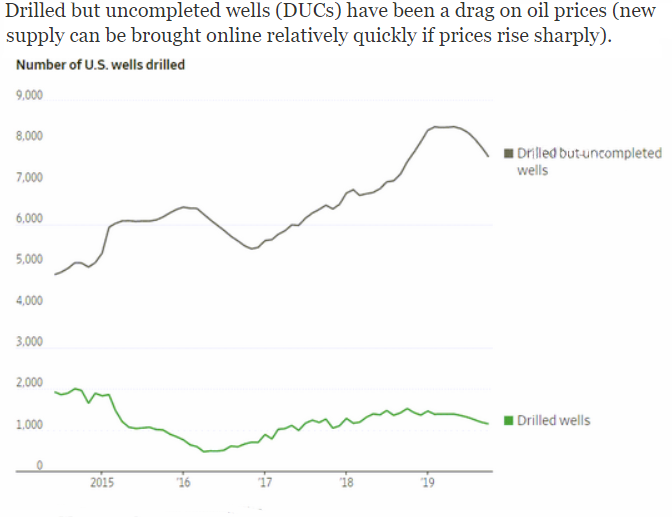
Source: The Wall Street Journal, from 11/21/19
5. And since natural gas is much cleaner than coal, we get the following:

Source: The Wall Street Journal, from 11/24/19
6. This makes the exchange rate between the USD and the Yuan much more important to these issues!
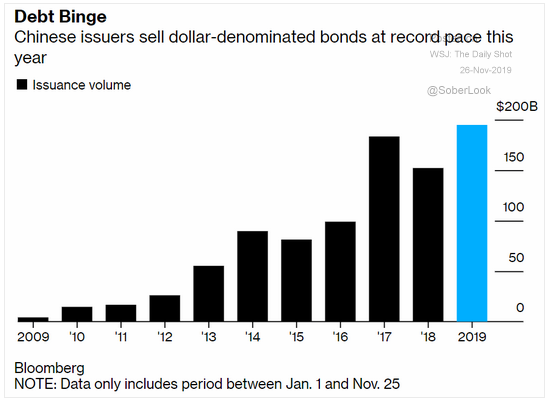
Source: WSJ Daily Shot, as of 11/25/19
7. This chart shows the disparity in the average working life between northern and southern Europe.
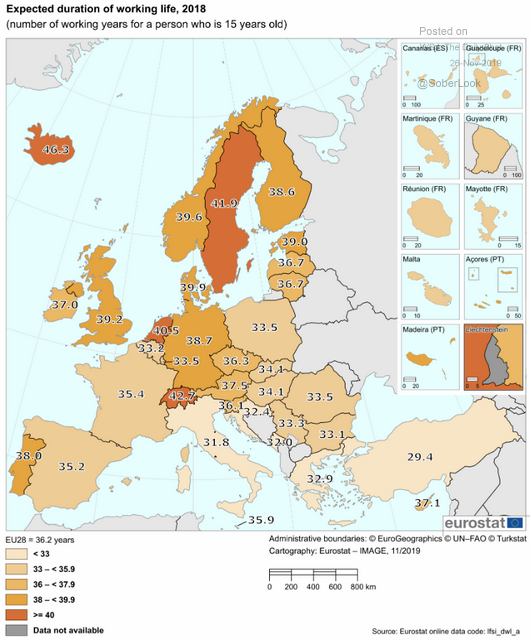
Source: WSJ Daily Shot, from 11/26/19
We hope you all have a safe and happy Thanksgiving! Check out our latest post on LinkedIn for some fun Thanksgiving statistics, and make sure you're following us for more from BCM.

Disclosure: The charts and info-graphics contained in this blog are typically based on data obtained from 3rd parties and are believed to be accurate. The commentary included is the opinion of the author and subject to change at any time. Any reference to specific securities or investments are for illustrative purposes only and are not intended as investment advice nor are a recommendation to take any action. Individual securities mentioned may be held in client accounts.