In a surprise (and rare—this marks the first since the financial crisis) inter-meeting move, the Federal Reserve issued an emergency 50-basis point rate cut yesterday to help stabilize the markets. It provided a short-lived boost, but the markets plunged again by the end of the day to erase much of Monday's rally. There were some signs of life this morning though, which is perhaps unsurprising given how the S&P 500 Index has typically reacted following a negative week. Is it sustainable? Like bear markets, recessions take time to unfold, and the 2010's were the first decade in U.S. history not to see one. Could a big one be looming? Coal consumption has plummeted in China (in an effect visible from space) as manufacturing has ground to a halt, and the services sector is feeling the weight too, falling to a record low of 26.5—well beyond contraction territory. Can this be turned around as the population begins to emerge from lockdown and head back to work? Meanwhile, Australian manufacturing is also under pressure and has entered contraction—prompting their central bank to issue their own record-setting rate cut—while Germany's recovery continues to gain traction. Have they seen the worst, or will their struggles return amid the current outbreak?
1. Yesterday's inter-meeting 50 bps rate cut was shrugged off by the markets. This chart shows other "emergency" cuts going back 20 years...

Source: WSJ Daily Shot, from 3/4/20
2. Bear markets take years to unfold and don't go down in a straight line. Some more historical perspective:
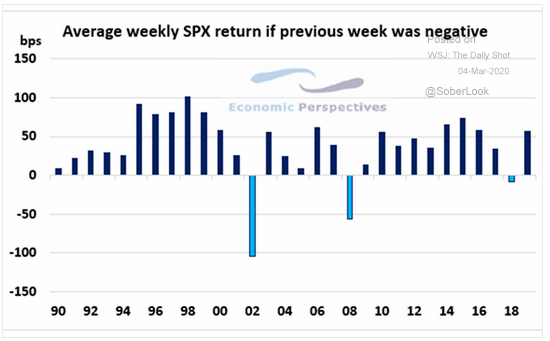
Source: Economic Perspectives, from 3/1/20
3. Some intermediate term perspective: the current correction has simply brought the S&P back to the middle of its uptrend channel.
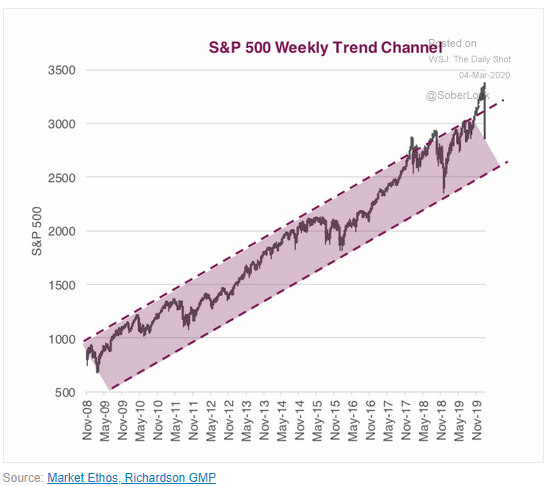
Source: WSJ Daily Shot, from 3/2/20
4. As we like to point out, when markets enter periods of stress, risk assets tend to correlate to 1!
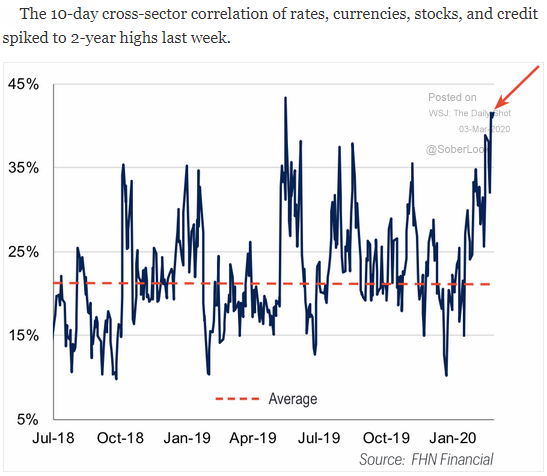
Source: WSJ Daily Shot, from 3/3/20
5. An interesting statistic. Has the information age allowed capitalism to become less volatile, or are we in for a big one?
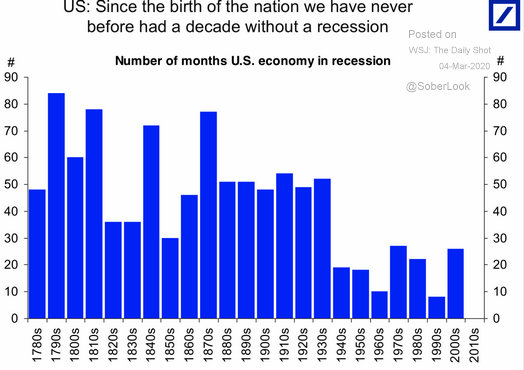
Source: The Chart Store, from 3/1/20
6. The Chinese economy is still in voluntary or involuntary lock-down...
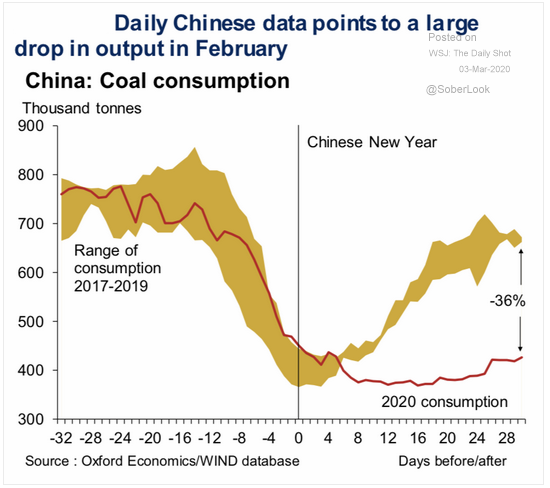
Source: WSJ Daily Shot, from 3/3/20
7. We normally do not show the services purchasing managers index but it is important to see the COVID-19 effects on the Chinese economy... a 50% reduction cannot be easily dismissed...
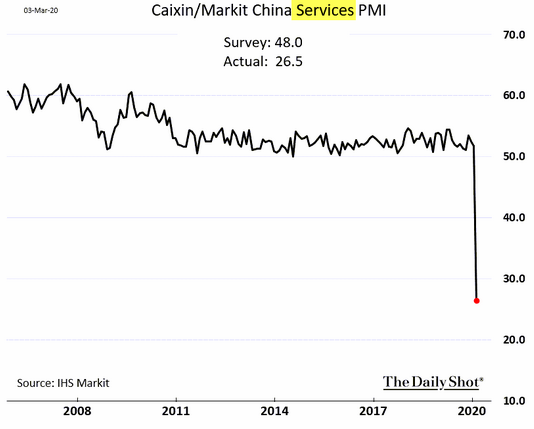
Source: WSJ Daily Shot, from 3/4/20
8. Here is the worry: China, understandably, has seen their manufacturing plummet. Will this also spread across the globe?
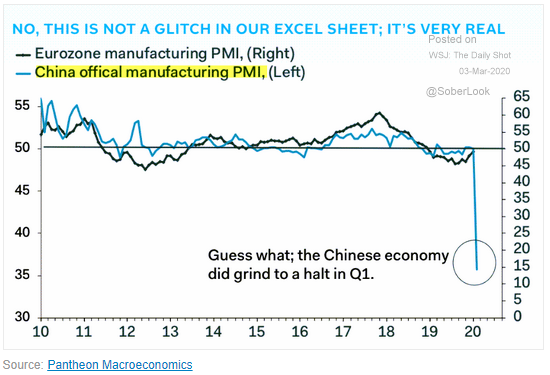
Source: WSJ Daily Shot, from 3/3/20
9. Yet if we can rely on the data, many regions are returning to work.
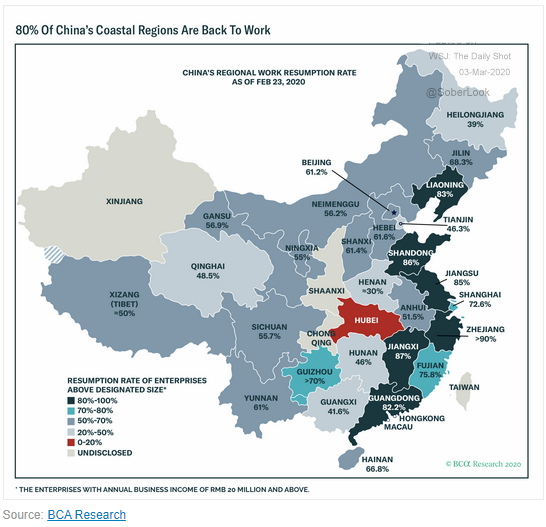
Source: WSJ Daily Shot, from 3/3/20
10. Europe has free and open borders just like the U.S. It will be much harder to quarantine large cities/areas like China did...
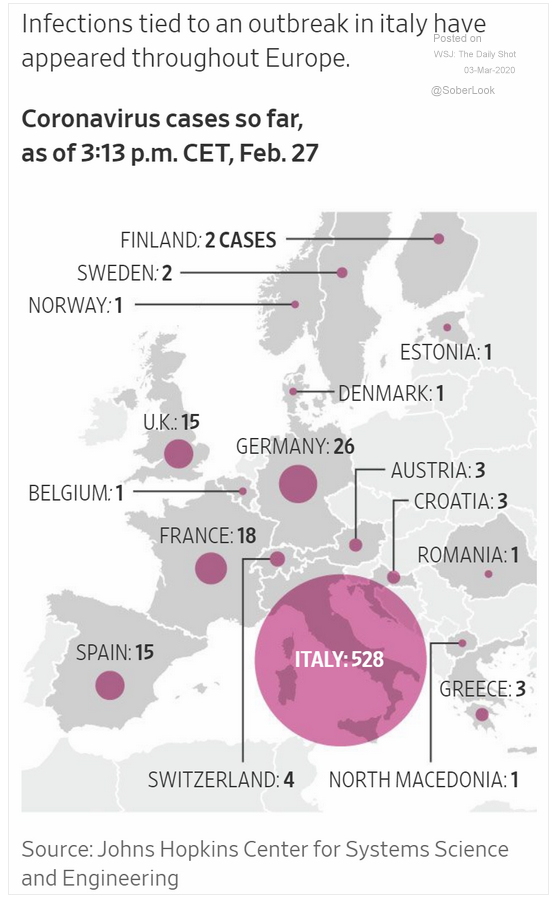
Source: WSJ Daily Shot, from 3/3/20
11. This helped Australia's central bank to cut their interest rate to a historic low of 0.5%
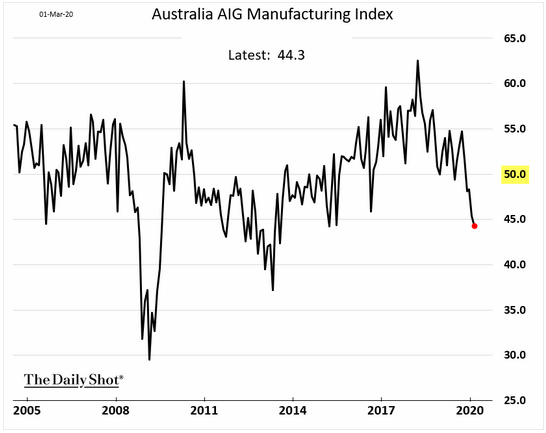
Source: WSJ Daily Shot, from 3/3/20
12. Has German manufacturing, and by extension, Europe as whole, seen the worst?
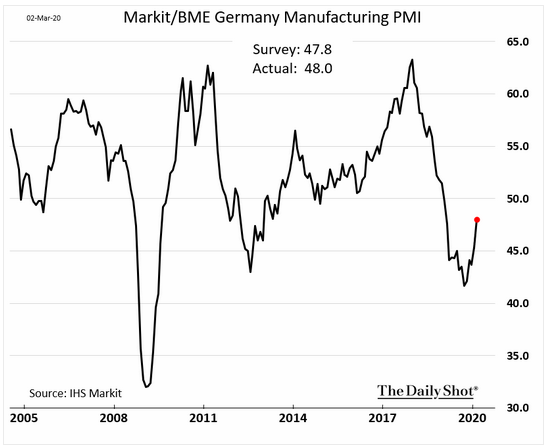
Source: WSJ Daily Shot, from 3/3/20
Are you worried there might be a bear approaching? While the current state of the markets might be cause for concern, it's important to remember that bear markets take time to unfold. Check out our piece "The Anatomy of a Bear Market" by BCM Portfolio Manager and Managing Partner Dave Haviland to learn the signs of an oncoming grizzly.

Disclosure: The charts and info-graphics contained in this blog are typically based on data obtained from 3rd parties and are believed to be accurate. The commentary included is the opinion of the author and subject to change at any time. Any reference to specific securities or investments are for illustrative purposes only and are not intended as investment advice nor are a recommendation to take any action. Individual securities mentioned may be held in client accounts.