Happy Friday, Fireside Charts readers, and welcome to our final post of 2019! The S&P 500 hit yet another all-time high yesterday following additional positive trade war news out of Washington, but we're still seeing some mixed signals on market and economic health. Investors look to be bracing for a market turn and have been increasingly gathering expensive put options in a search for downside protection. And they could be on the right track as the CAPE ratio—a cyclically-adjusted P/E ratio that indicates if the market is over or undervalued—just climbed above 30 for the fourth time ever, joining previous historic peaks in 1929 and 2000 that occurred just ahead of some of history's most devastating sell-offs. Should we be preparing for history to repeat itself? Maybe not, according to Dr. Copper... Meanwhile, while large caps have been throwing their weight around enough to drag the rest of the market to all-time highs (despite unremarkable performance from other regions), current market-cap as a percent of the S&P 500 is nothing in comparison to what it once was. Can you guess which company once captured more than double Apple's share of the index?
Enjoy the rest of the holiday season, and we'll see you in 2020!
1. This can get expensive (you need to keep buying the puts)!
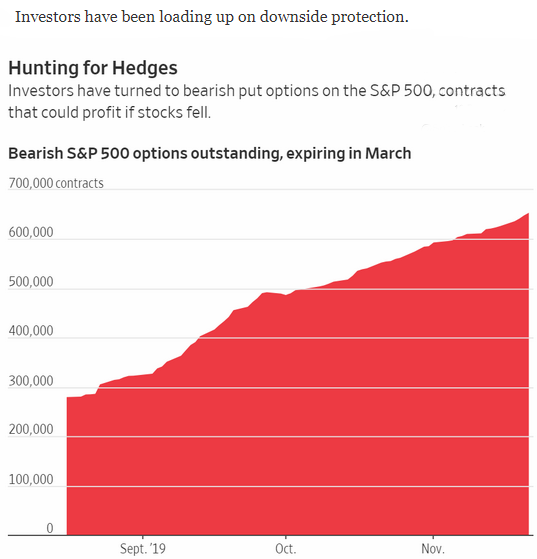
Source: WSJ Daily Shot, from 12/19/19
2. Long term perspective:
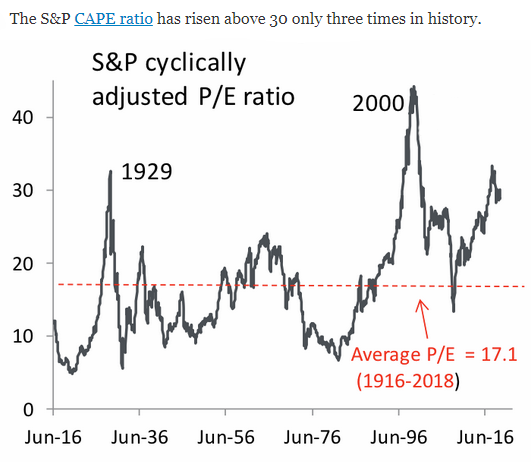
Source: WSJ Daily Shot, from 12/18/19
3. An encouraging sign!
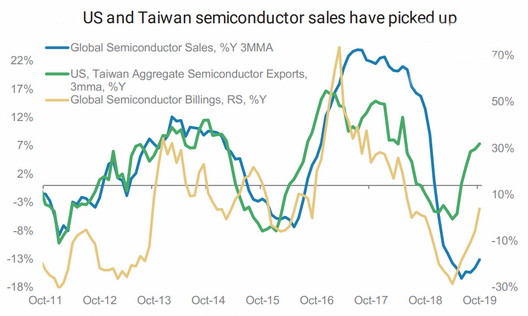
Source: Morgan Stanley Research, from 12/19/19
4. What are the drivers of this bull market?
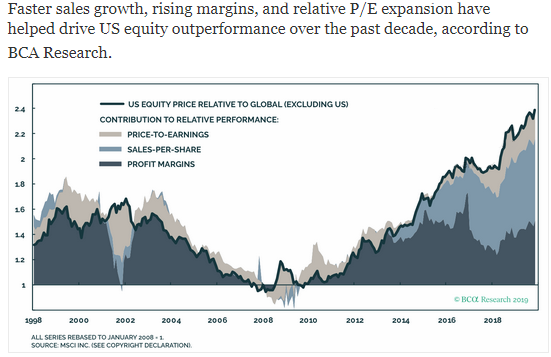
Source: WSJ Daily Shot, from 12/19/19
5. Will 2020 (finally) see some leadership change?
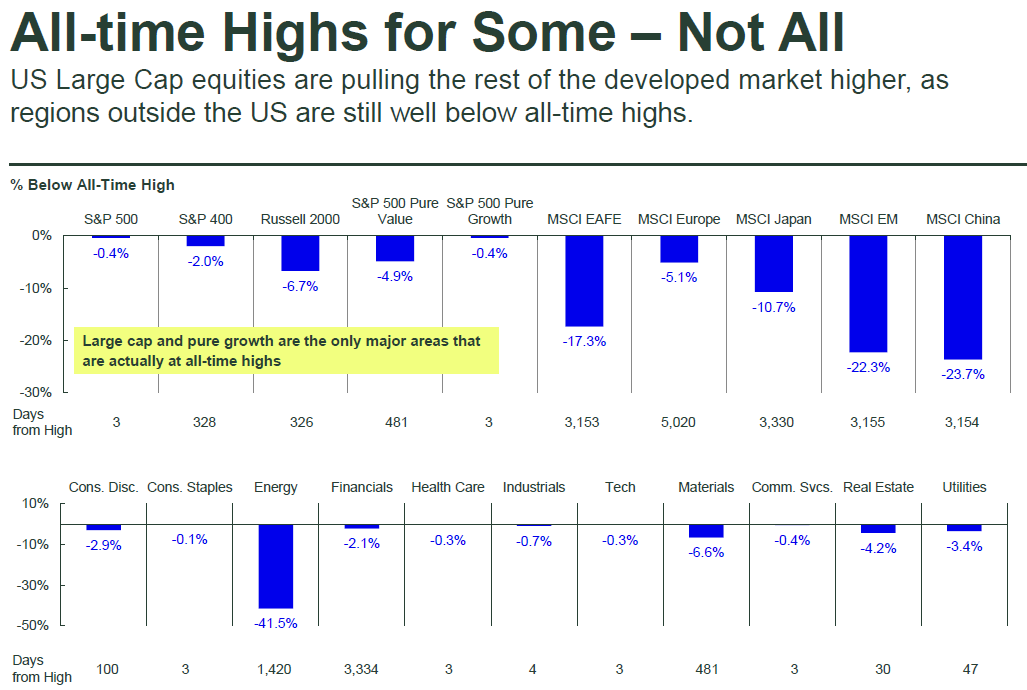
Source: SSgA, as of 11/30/2019
6. Is the "Doctor" in?
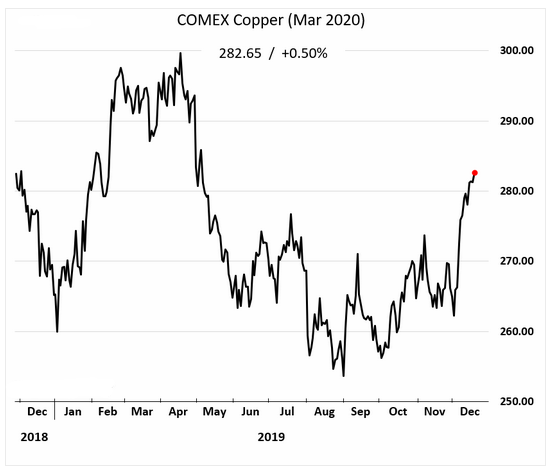
Source: WSJ Daily Shot, from 12/20/19
7. The same can often be said about China's economic data...
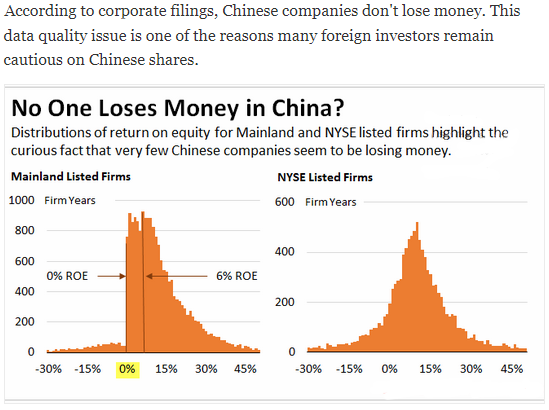
Source: WSJ Daily Shot, from 12/20/19
8. Not the most scientific of measures, but it is fun and has holiday colors...
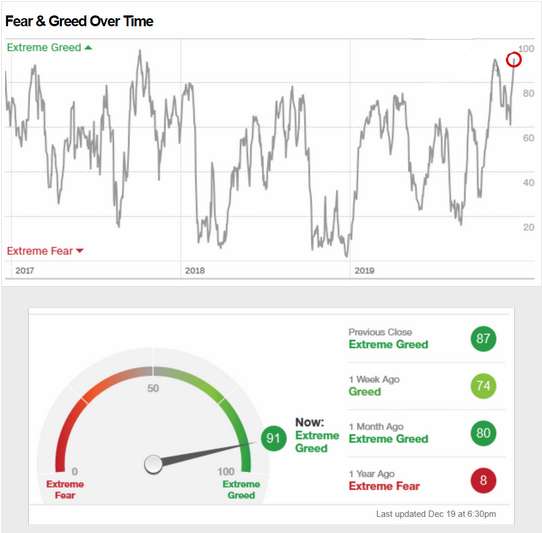
Source: CNN Business, from 12/19/19
9. As big as the FAANG stocks are today, it can be fun to look back!
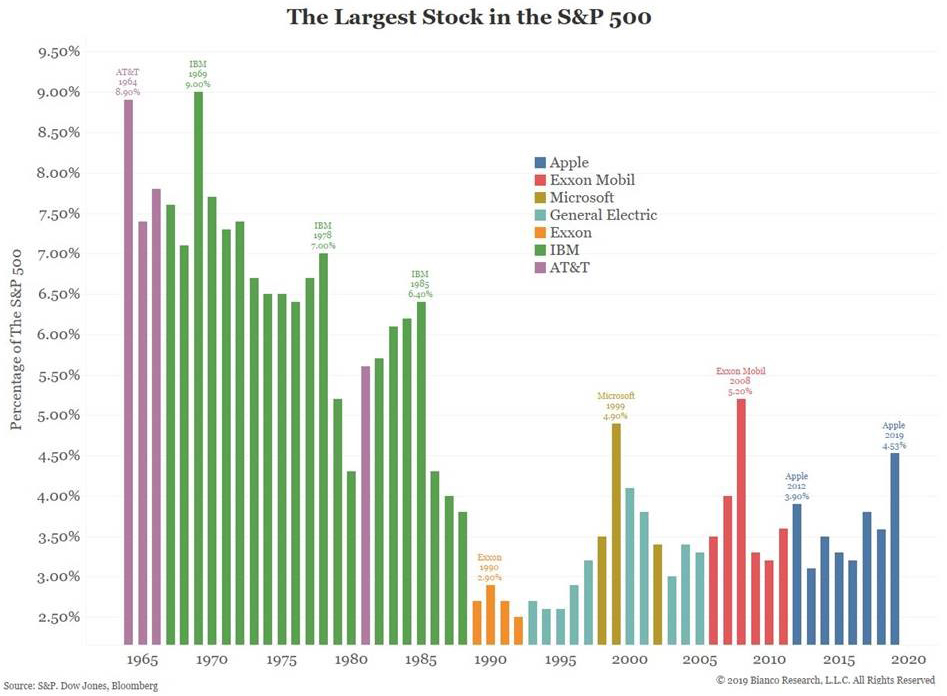
Source: Bianco Research, from 12/19/19
Big news! BCM is growing in 2020, and we're looking for an internal wholesaler to join our dynamic internal sales desk. If you know someone in the Boston area looking to contribute to an exciting asset management firm and help advisors promote their clients' well-being, click below to send them the application link!

Disclosure: The charts and info-graphics contained in this blog are typically based on data obtained from 3rd parties and are believed to be accurate. The commentary included is the opinion of the author and subject to change at any time. Any reference to specific securities or investments are for illustrative purposes only and are not intended as investment advice nor are a recommendation to take any action. Individual securities mentioned may be held in client accounts.