After a straight week of market losses, there were some signs of stabilization this morning—the question is whether it will last or amount to a head-fake. The S&P 500® Index at least has crossed into oversold territory, and central banks look to be taking notice. On Friday, Fed Chairman Jerome Powell opened the door to additional rate cuts to counter the "evolving risks" poised by the coronavirus, and—from the looks of economic headlines—we may soon see a coordinated global easing effort by central banks. The 30-year just hit another record low at 1.65% and the entire (inverted) yield curve now shows negative real rates... Will longer term yields bottom this week as central banks begin to take action? Finally, though it's been a record-setting market rout and U.S. large-caps haven't been immune, 1-year returns for eight of the eleven sectors of the S&P 500 remained positive as of the end of last week, and a few of them are even posting double digits.
1. Despite the enormity of the COVID-19 outbreak, was the market reaction too much, too fast or the opposite?

Source: The Chart Store, from 3/1/20
2. This selloff has been largely driven by fear, but If you are healthy, worrying about dying from COVID-19 is not worth the worry. As the first chart shows, mortality rates for those under 50 are similar to a bad flu season, and even within the more elderly cohorts, pre-existing conditions play a large role.
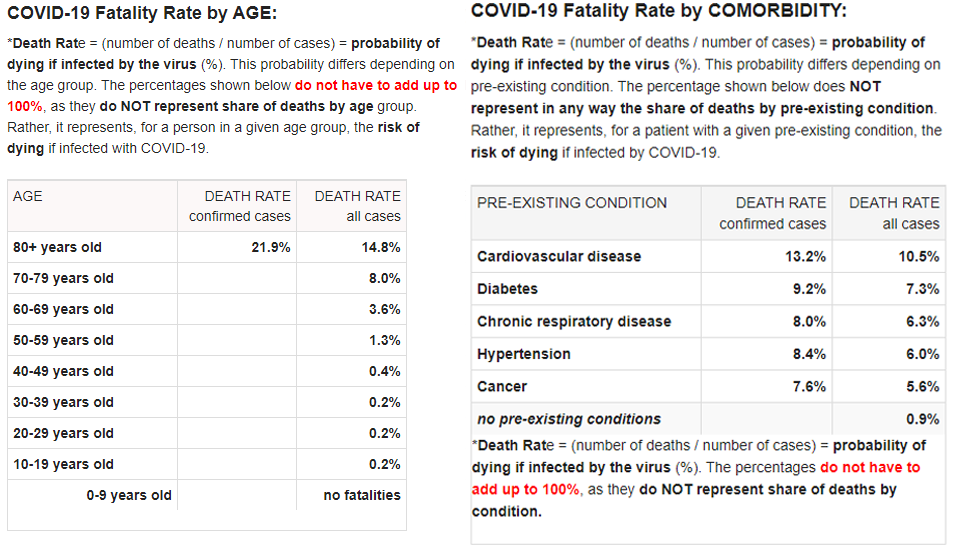
Source: Worldometer.com, as of 2/29/20
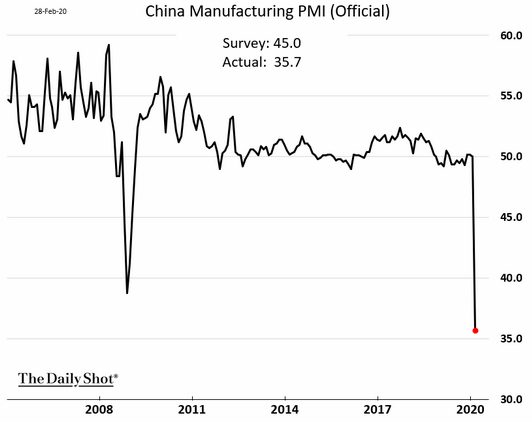
3. Will the world's Central Banks, a solid contributor to the 11 year bull market, step in to save the day once again? If so, will it work?
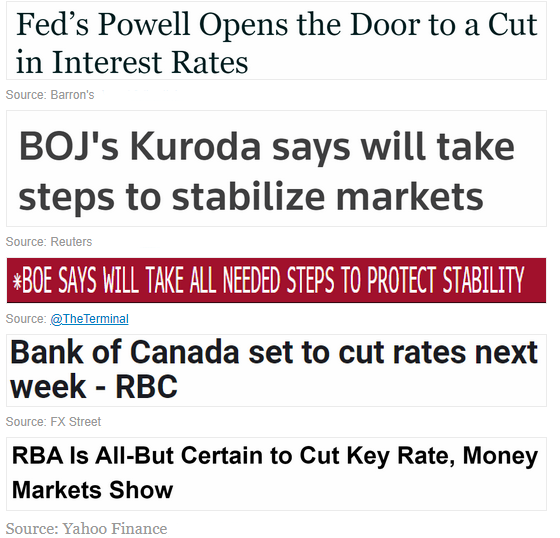
Source: WSJ Daily Shot, from 3/2/20
4. Another record low yield...
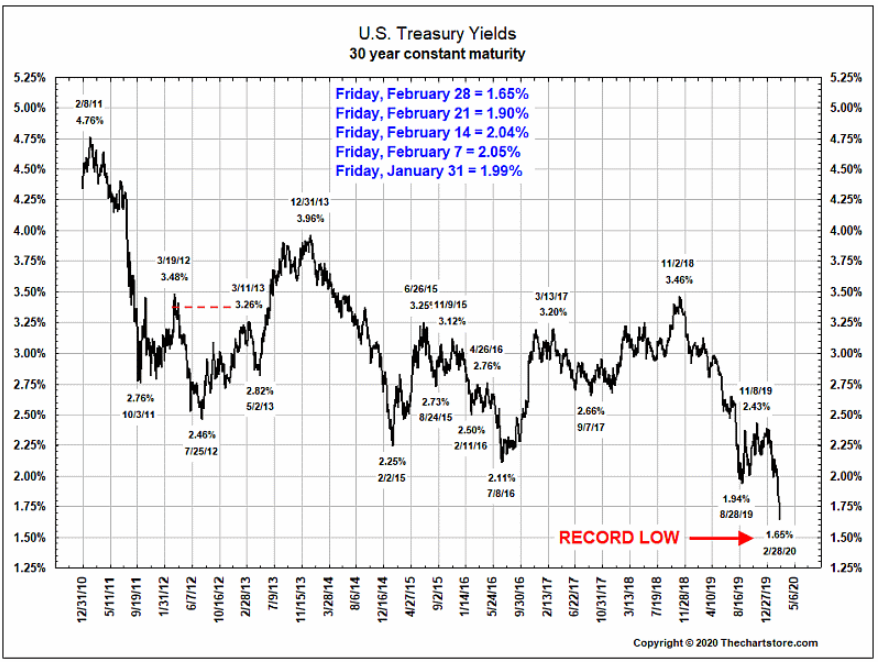
Source: The Chart Store, from 3/1/20
5. The U.S. Yield curve is inverted again... and the entire curve now shows negative real rates...
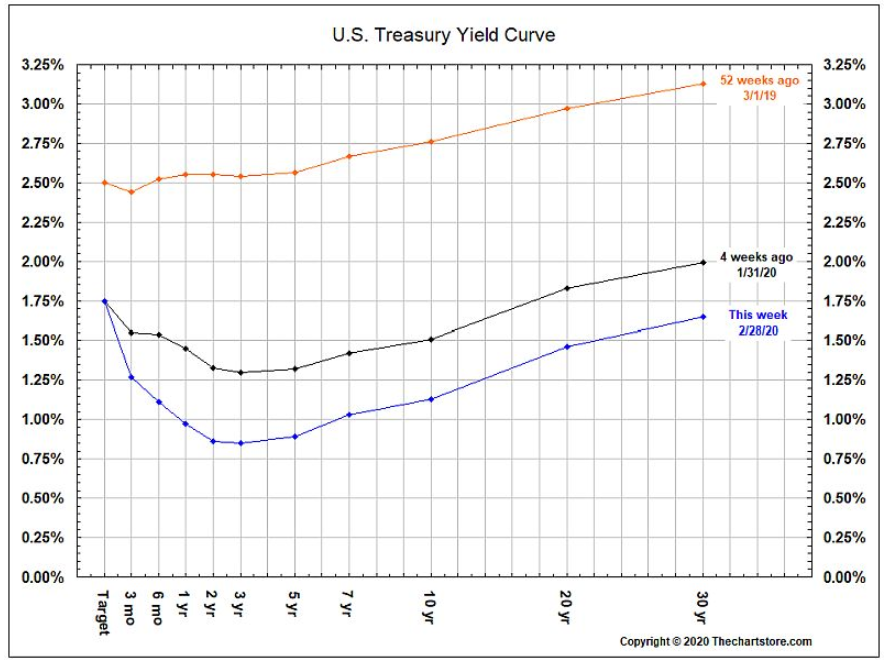
Source: The Chart Store, from 3/1/20
6. Factually correct yet stating the obvious...
Source: WSJ Daily Shot, from 3/2/20
7. Just as a reminder, the following are the GICS Sector 1-year returns ending on leap day.

Source: The Chart Store, from 3/1/20
If you missed it last week, take a look at "From The Desk of the PM - Update on Market Selloff and Coronavirus Fears" for the BCM portfolio management team's thoughts on the current market unrest.

Disclosure: The charts and info-graphics contained in this blog are typically based on data obtained from 3rd parties and are believed to be accurate. The commentary included is the opinion of the author and subject to change at any time. Any reference to specific securities or investments are for illustrative purposes only and are not intended as investment advice nor are a recommendation to take any action. Individual securities mentioned may be held in client accounts.