Five months in to an unprecedented year for the markets and U.S. equities have staged a furious rebound from their March troughs. Large caps are still leading the charge with the S&P 500® Index clawing its way up from a return of ~-30% to -5.77%. Will the upward trajectory continue despite a tumultuous (and gut-wrenching) weekend of unrest across the country? They could perhaps see a boost from the reinvigorated manufacturing and services sectors where regional PMIs saw significant recovery in May, but data shows that Americans seem more inclined to save than spend these days, so cash flow may remain an issue for businesses dependent on disposable income. Gold is up ~13.5% for the year while other commodities lag, but Crude has seen a massive recovery since its April low, climbing roughly 40% in a single month. Will it continue to inch toward positive territory as economies reopen and demand increases? Finally, while the Fed's balance sheet has skyrocketed with an unprecedented volume of bond purchases, they are not the only buyer of U.S. debt—Japan got in on the action in a big way back in March as COVID-19 exploded as a global threat. Is that investment likely to continue, given that global infection numbers are still on the rise? We'll have to wait and see.
1. In total, the Fed's Regional surveys showed solid improvement in May:
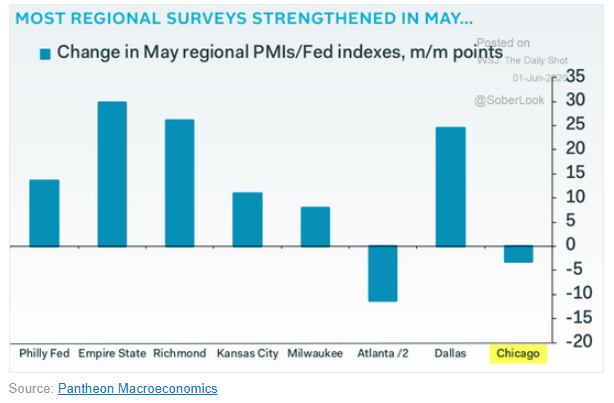
Source: WSJ Daily Shot, from 6/1/20
2. The average American is socking away some of their stimulus cash and other savings for whatever the future holds...
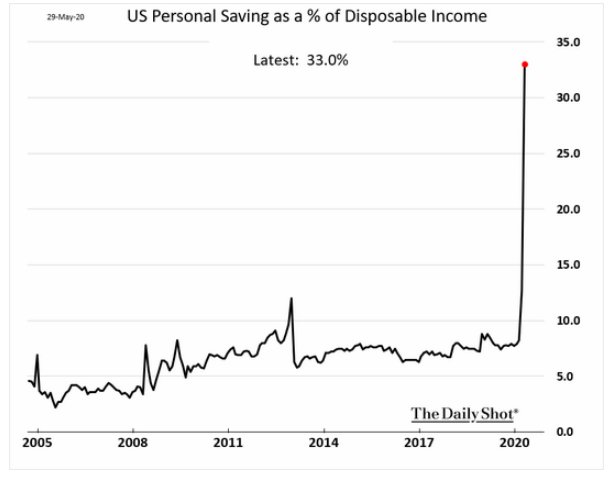
Source: WSJ Daily Shot, from 6/1/20
3. A June 1st update:
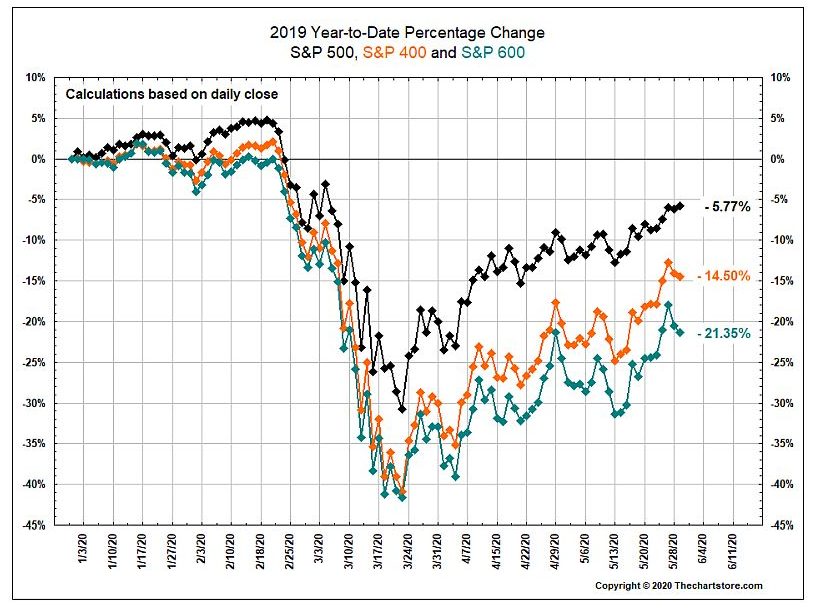
Source: The Chart Store, from 5/31/20
4. What have commodities done year to date?
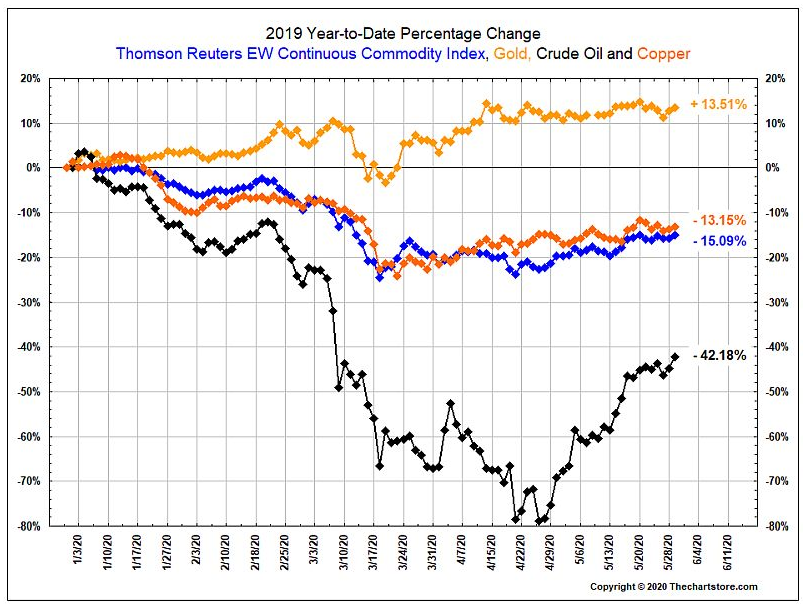
Source: The Chart Store, from 5/31/20
5. Junk bonds have continued their recovery...
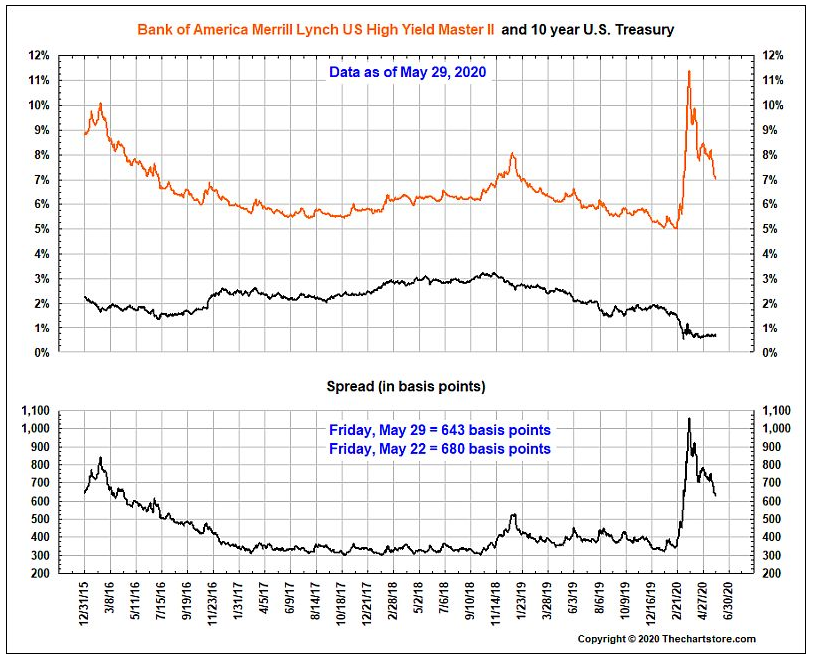
Source: The Chart Store, from 5/31/20
6. Don't fight the Fed... they have bought $3.334 trillion of bonds so far and each day sets a record for the size of their balance sheet...
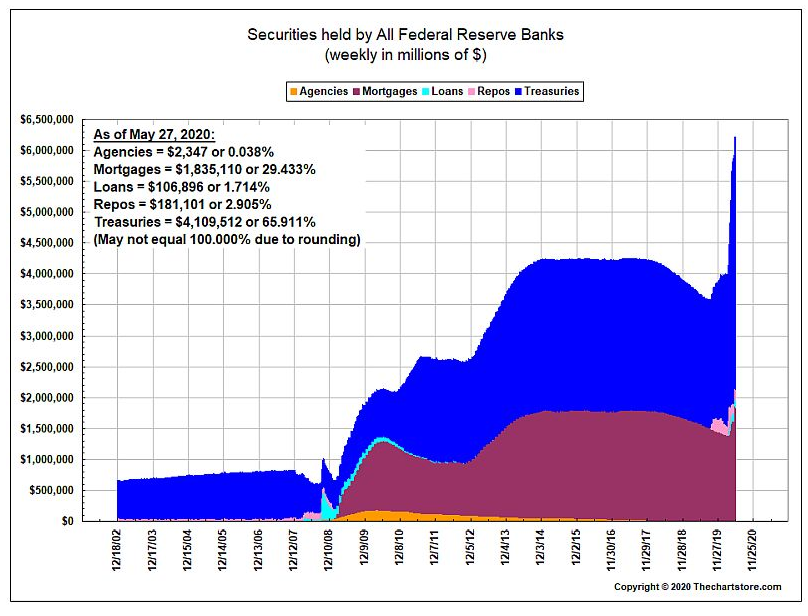
Source: The Chart Store, from 5/31/20
7. The Fed is not the only buyer of U.S. debt...
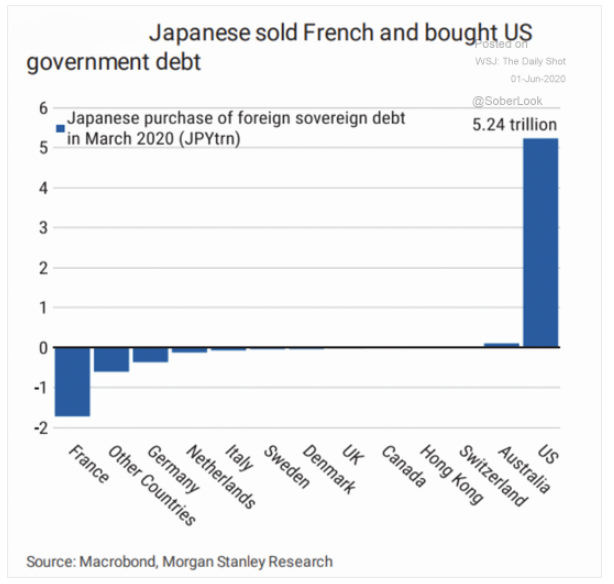
Source: WSJ Daily Shot, from 6/1/20
8. Covid is exploding in South America, India, and in many developed nations where the healthcare systems will be quickly overrun. New cases of the virus have stopped declining in the U.S. as well...
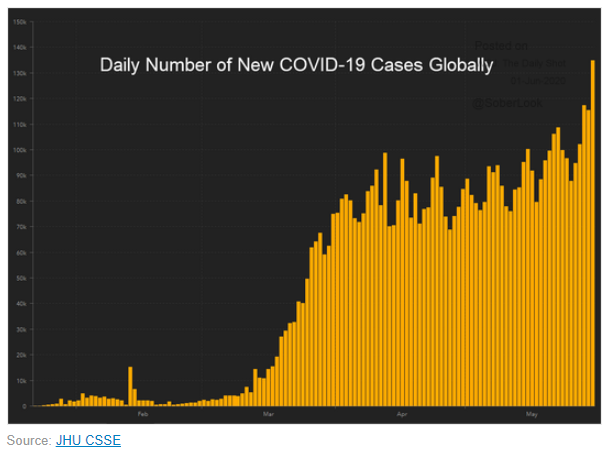

Source: WSJ Daily Shot & JHU CSSE, from 6/1/20
9. It is interesting to see the trends change as many of us continue to work remotely...
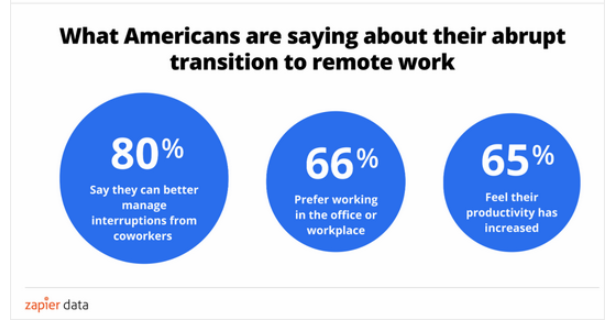
Source: WSJ Daily Shot, from 6/1/20
Not seeing a topic that you want to learn more about in our weekly chart blogs? Submit your thoughts to our team below!

Disclosure: The charts and info-graphics contained in this blog are typically based on data obtained from 3rd parties and are believed to be accurate. The commentary included is the opinion of the author and subject to change at any time. Any reference to specific securities or investments are for illustrative purposes only and are not intended as investment advice nor are a recommendation to take any action. Individual securities mentioned may be held in client accounts.