Recently a reader asked us to explain “the recent Repo Market Fiasco and the Fed’s intervention,” as well as the consequences and outcomes. For those of you who regularly read our blog, we first included a chart on this subject on September 23, 2019. The answer is fairly technical, but let’s focus on some charts to show the enormity of the issue first.

Source: The Chart Store, from 2/14/2020
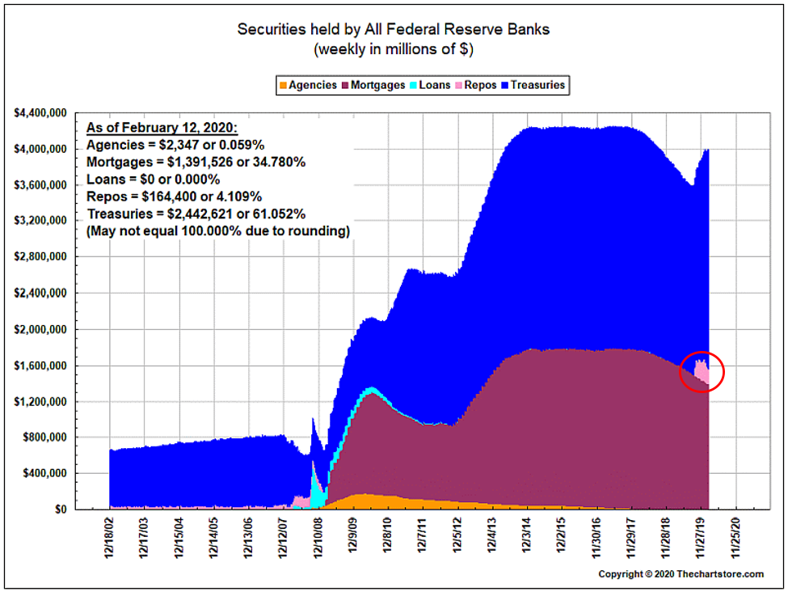
To back up for a bit, at the beginning of the last financial crisis in 2008, the Fed’s balance sheet was ~$800 billion (see chart below). To avert an even greater economic calamity, the Fed purchased ~$3.7 trillion of bonds of all types of maturities. They even purchased ~$1.4 trillion of “quasi-government” agency and/or mortgage bonds. The purpose was to lower interest rates of all maturities to stimulate the economy and/or to allow the economy to recover from the Great Recession. In the chart above, the gray area represents the well-publicized Quantitative Easing (QE) reversal of almost $680 billion. This is the amount of bonds that were sold or allowed to mature by the Fed as the need to stimulate waned. This was certainly short-lived as shown by the red circled area, which represents the amount of additional purchases the Fed has had to make to deal with the repurchase agreement (repo) “fiasco.”
For a more in-depth explanation of the issue, please check out the following link to the Brookings Institute as it is an excellent recap of what happened with the repo markets and why the Fed needed to act by once again buying bonds/repos. We could re-write it, but sometimes someone has just nailed it!
Source: The Chart Store, from 2/14/2020
In short, the Fed has injected almost $500 billion into the markets in response to a shortage of overnight capital available to banks and institutions. They have “solved the problem,” but have added back about two-thirds of the amount they “unwound” in the process.
Thanks for your question and please keep them coming!

Disclosures:
Copyright © 2020 Beaumont Capital Management (BCM). All rights reserved.
The views and opinions expressed throughout this post are those of our Portfolio Manager as of March 3rd, 2020. The opinions and outlooks may change over time with changing market conditions or other relevant variables.
This material is for informational purposes only. It is not intended as an offer or solicitation for the purchase or sale of any security or financial instrument, nor should it be construed as financial or investment advice. The information presented in this report is based on data obtained from third party sources. Although it is believed to be accurate, no representation or warranty is made as to its accuracy or completeness.