U.S. retail sales dropped unexpectedly in September for the first time in seven months in what many analysts consider an early sign that the global manufacturing slowdown and trade war anxiety are finally starting to weigh on consumers (re: the driving force behind ~70% of the U.S. economy). Is this a blip—especially given that numbers are still up YoY, unlike Industrial Production—or the onset of a new pattern? Treasury yields dipped slightly following the soft retail numbers, but seem to have stabilized, and yields are starting to rise in Europe despite ongoing weakness. Are the positive Brexit headlines to thank? And speaking of bonds: the recent volatility, shifting relationship between asset classes, and growing correlation between bonds and equities lead Bank of America to declare "The End of the 60/40" Portfolio"—the title of a research note published this week that argues investors should shift their allocations more fully towards equities and "reconsider the role of bonds in [their] portfolio." Could this mark the end of an era in financial planning?
1. September retail sales missed expectations and dropped for the first time since February.
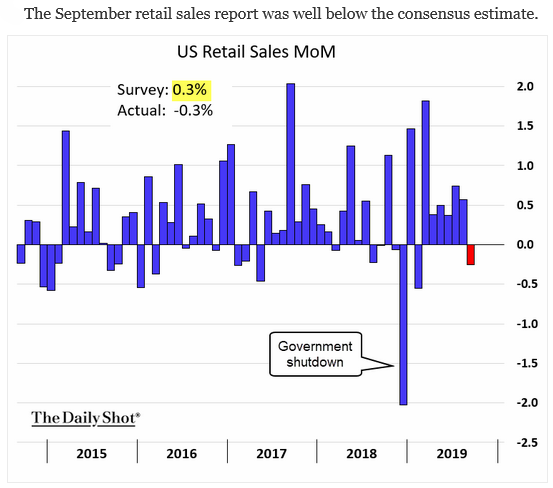
Source: WSJ Daily Shot, as of 10/17/19
2. Yesterday saw the U.S. Industrial production disappoint to the downside and it is now negative on a year over year basis.
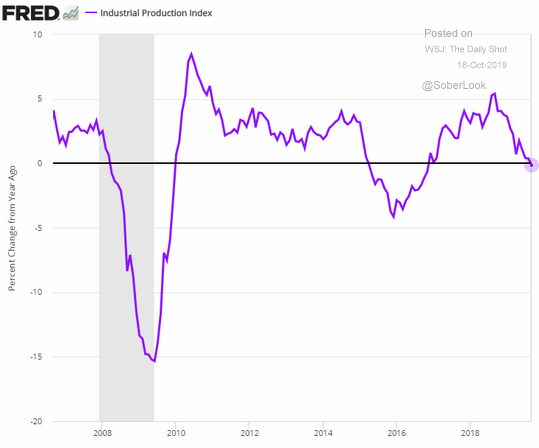
Source: WSJ Daily Shot, as of 10/18/19
3. Are we nearing a watershed moment?
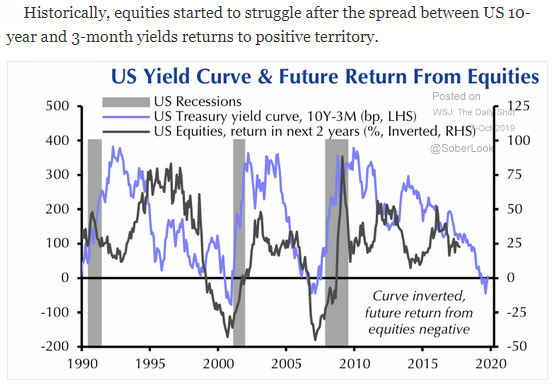
Source: Capital Economics, as of 10/17/19
4. If the current trend continues, bonds will be less likely to moderate equity volatility and returns. Will MPT, the concept of diversification, and a 60/40 portfolio still work?
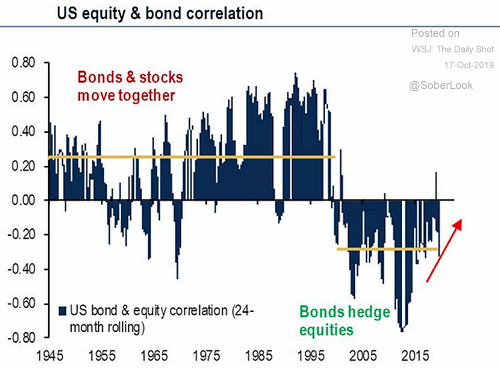
Source: BofA Merrill Lynch Global Research, as of 10/16/19
5. Most still have negative yields...
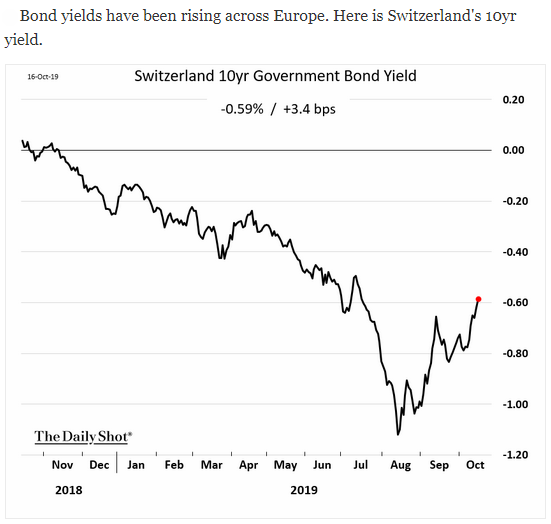
Source: WSJ Daily Shot, as of 10/17/19
6. An update on two of the largest foreign owners of U.S. Treasuries:
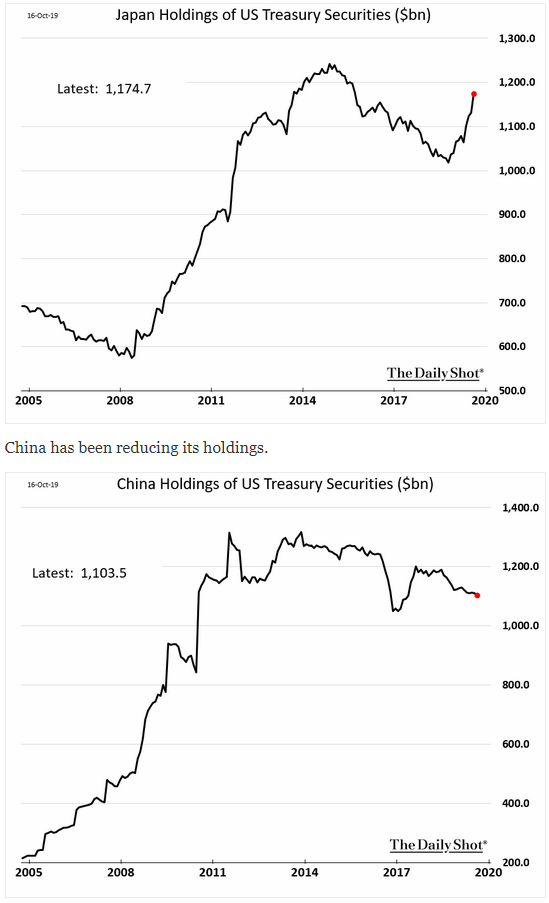
Source: WSJ Daily Shot, as of 10/17/19
7. China's GDP continues to slow. Do you trust their data?
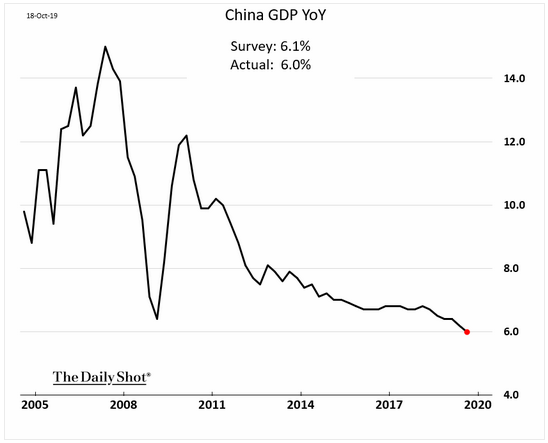
Source: WSJ Daily Shot, as of 10/18/19
8. Now, if they can only get this deal through Parliament... an uncertain prospect at best as PM Johnson has no majority...
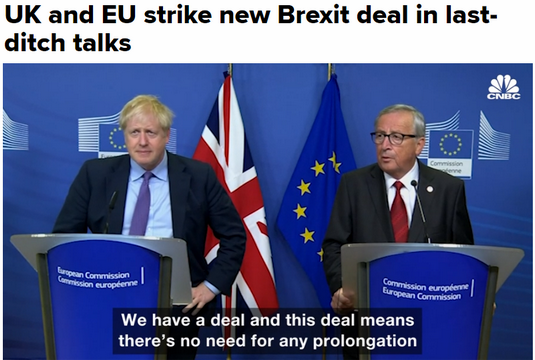
Source: CNBC, as of 10/17/19
9. The U.K.'s Financial Times is predicting a loss. Wouldn't it be nice to just have this end?!
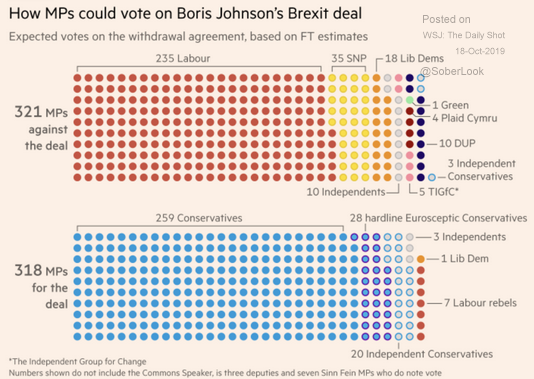
Source: Financial Times, as of 10/17/19
10. Germany and the rest of Europe account for 15% of the world's imports...their growth slowdown affects us all!
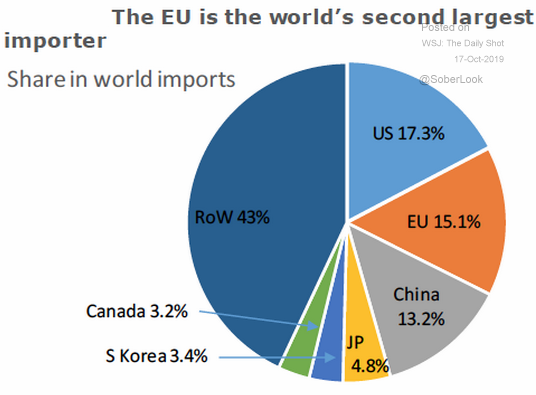
Source: ANZ Research, as of 10/17/19
11. And a look back at U.S. exports in 2018:
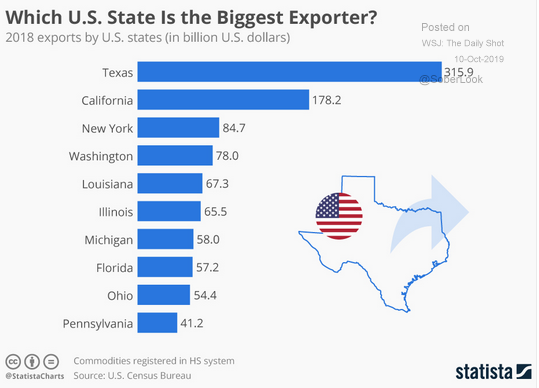
Source: Statista, as of 9/25/19
Did you miss our quarterly commentary last week, or are you maybe just hankering for a re-read? We wouldn't blame you. Head over to ETFtrends to read our 3Q analysis "Blinking Yellow Lights: The Inverted Yield Curve and Other Recession Indicators" for a breakdown of the major third-quarter events, trends, and implications!

Disclosure: The charts and info-graphics contained in this blog are typically based on data obtained from 3rd parties and are believed to be accurate. The commentary included is the opinion of the author and subject to change at any time. Any reference to specific securities or investments are for illustrative purposes only and are not intended as investment advice nor are a recommendation to take any action. Individual securities mentioned may be held in client accounts.