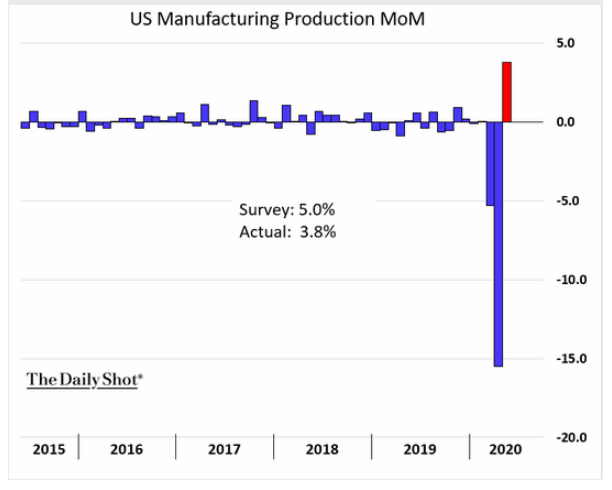
U.S. retail activity came back with a vengeance in May following April's disastrous 14.7% plunge—the 17.7% spike is the largest ever monthly increase in spending and could hint at reemerging consumer sentiment. Manufacturing activity, another strong indicator of economic health, has followed a similar trend, but what does recovery look like in other sectors? The markets have staged a remarkable comeback in recent months and climbed yet again on news of yet more government stimulus, but investors remain torn between reopening optimism and anxiety over infection spikes—COVID-19 cases rose again in Florida and Texas hospitalizations have reached a record high. The popularity of index funds has soared in recent years, but with markets still turning on a dime, we're wondering if investors may start to crave more active management. The Fed is fighting hard to prop up the markets and the White House is reportedly drafting a $1 trillion infrastructure spending proposal to inject some life into the economy, but are these massive stimulus efforts sustainable?
1. Pent up demand for essential items cannot be delayed forever
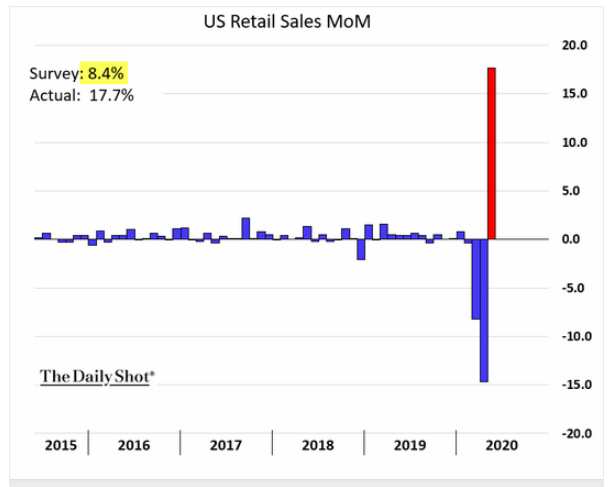
Source: WSJ Daily Shot, from 6/17/20
2. A "closed and open" case?

Source: WSJ Daily Shot, from 6/16/20
3. As some states start to reopen, the economy will start to recover...
Source: WSJ Daily Shot, from 6/17/20
4. What does the recovery look like? Here is one view:
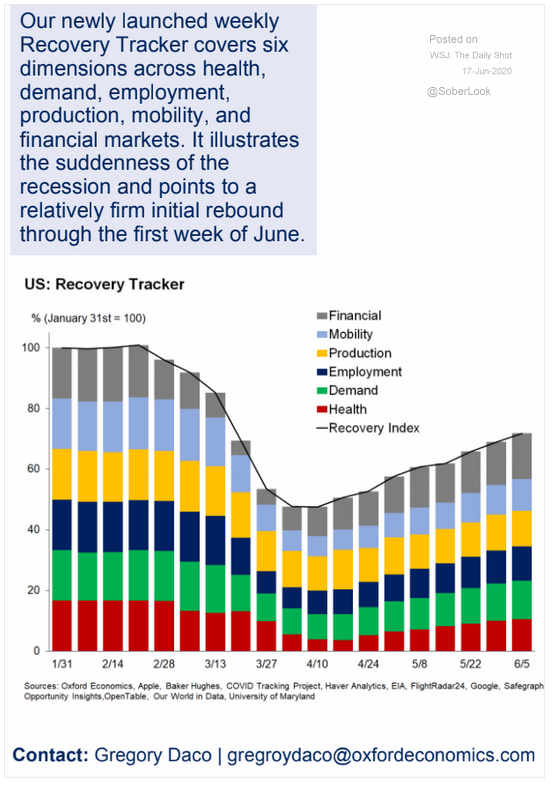
Source: WSJ Daily Shot, from 6/17/20
5. It is a tough job market for 2020 graduates...
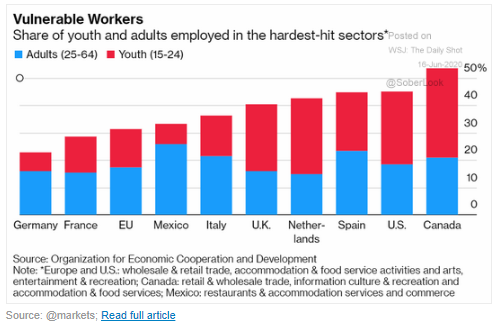
Source: WSJ Daily Shot, from 6/16/20
6. For what it is worth...as of yesterday.
Source: WSJ Daily Shot, from 6/17/20
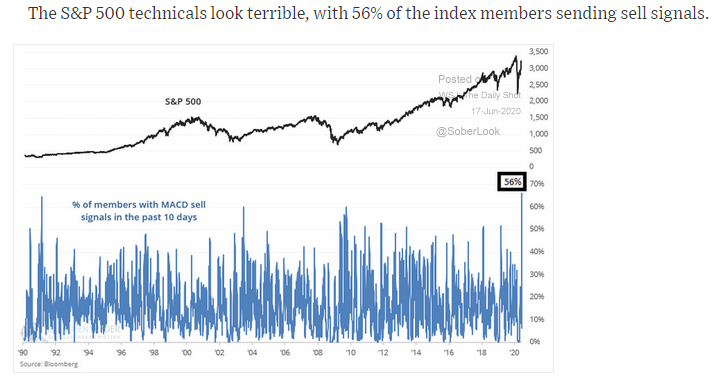
7. Is the new normal that instead of many days (weeks), rallies and drawdowns are packed into just a few days like 1987? The speed of movement is concerning...

Source: WSJ Daily Shot, from 6/16/20
8. As indexing in the S&P 500 accelerates, now over $4.5 trillion, are there unforeseen effects on the markets?
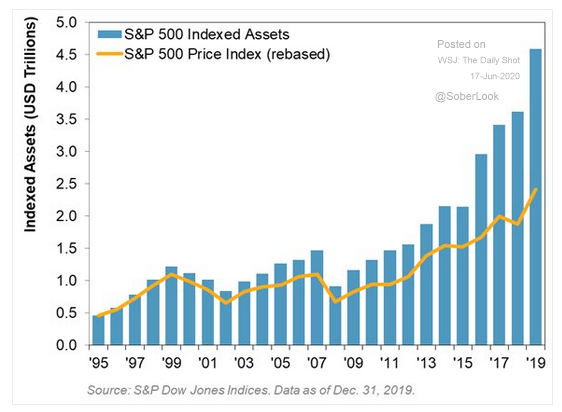
Source: WSJ Daily Shot, from 6/17/20
9. Why the sudden rebound? Don't fight the Fed... especially when it's QE is unlimited. Are the markets dependent on stimulus?
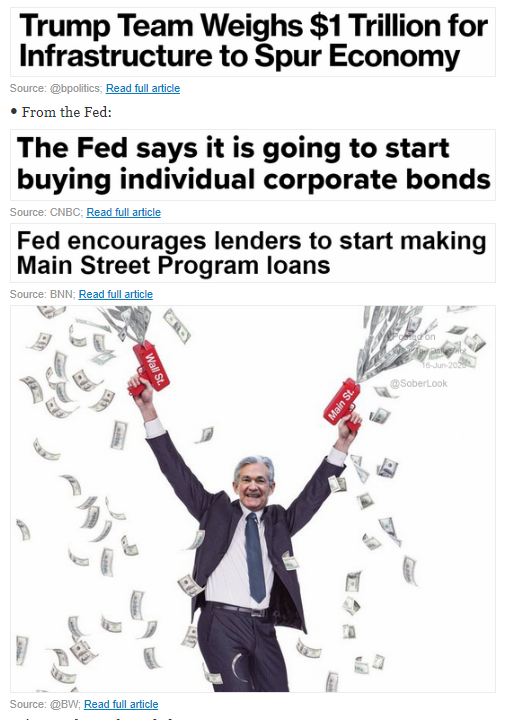
Source: WSJ Daily Shot, from 6/16/20
10. Will the Fed's recent actions continue this trend?

Source: WSJ Daily Shot, from 6/16/20
11. The Fed is not alone in this fight...
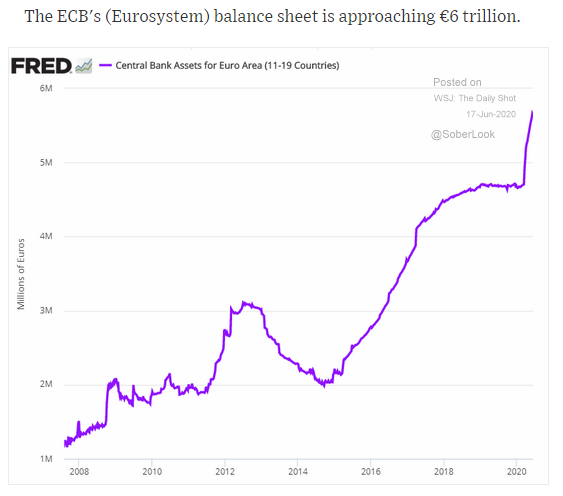
Source: WSJ Daily Shot, from 6/17/20
12. Wow. Tesla sells less than 1/10th the cars as Toyota...
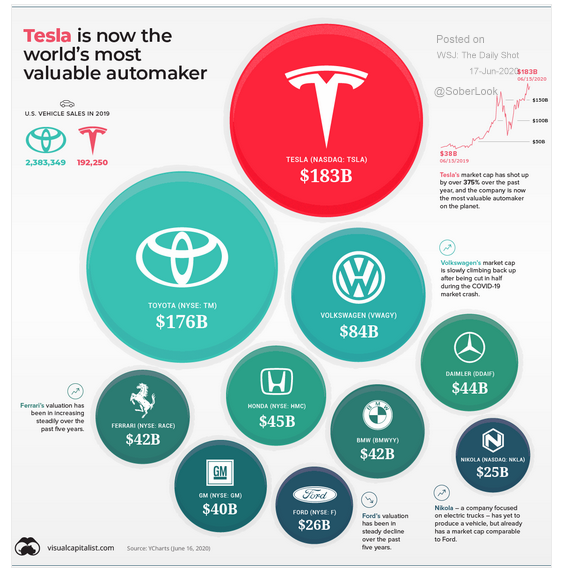
Source: WSJ Daily Shot, from 6/17/20
13. Where is your "mother tongue" from?
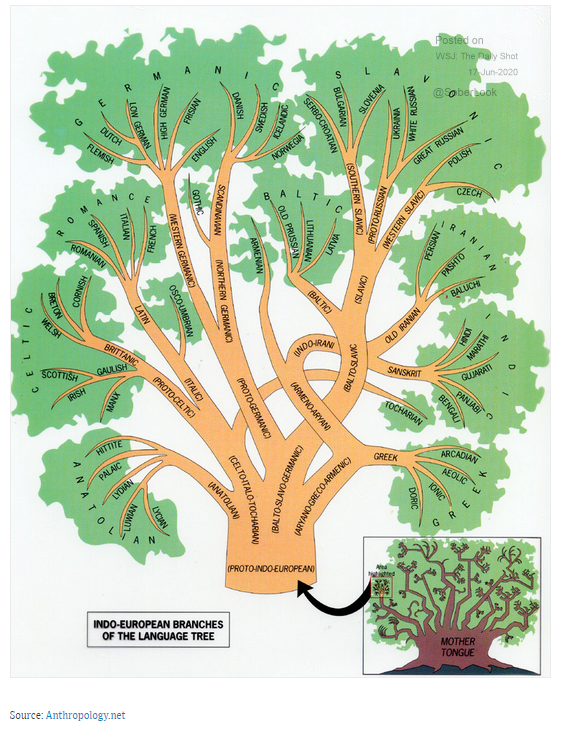
Source: WSJ Daily Shot, from 6/17/20
The trajectory of a bear market isn't straight down, and rallies don't necessarily mean a bear has come to a close. Is it possible that's what we're seeing in the markets right now? Read “The Anatomy of a Bear Market” by BCM Portfolio Manager Dave Haviland to see how past bears have played out and why this one isn't necessarily over.

Disclosure: The charts and info-graphics contained in this blog are typically based on data obtained from 3rd parties and are believed to be accurate. The commentary included is the opinion of the author and subject to change at any time. Any reference to specific securities or investments are for illustrative purposes only and are not intended as investment advice nor are a recommendation to take any action. Individual securities mentioned may be held in client accounts.