Happy Veteran's Day, Fireside Charts readers! Out of respect for the holiday, the bond market is closed and no new economic reports are due out today, but even on a holiday Monday, analysts are likely keeping their eyes peeled for more U.S./China trade news. While hopes surged Thursday for an approaching deal, President Trump reiterated his rejection of the claims over the weekend, stating that the tariff reduction story was "over reported." The S&P 500 backed off its recent all-time highs in response to the confusion, and now we're left wondering if it may soon be pushed out (one way or the other) of its established trend lines. Inflation looks to be picking up in China, where CPI came in higher than expected at 3.8% for October—primarily thanks to surging pork prices. Meanwhile, declining PPI hints that producer margins may be suffering. Neither measure seems to have harmed consumer sentiment however, as Alibaba's 24-hour "Singles Day" shopping event hit $38 billion today, leaving Prime Day, Black Friday, and Cyber Monday in its dust. Finally, some good news on manufacturing: we saw an uptick in sentiment from global steel and aluminum PMI this month—could the sector finally be poised for recovery?
1. With fresh all-time highs under its belt, is the S&P 500 due for a pause or a break out?
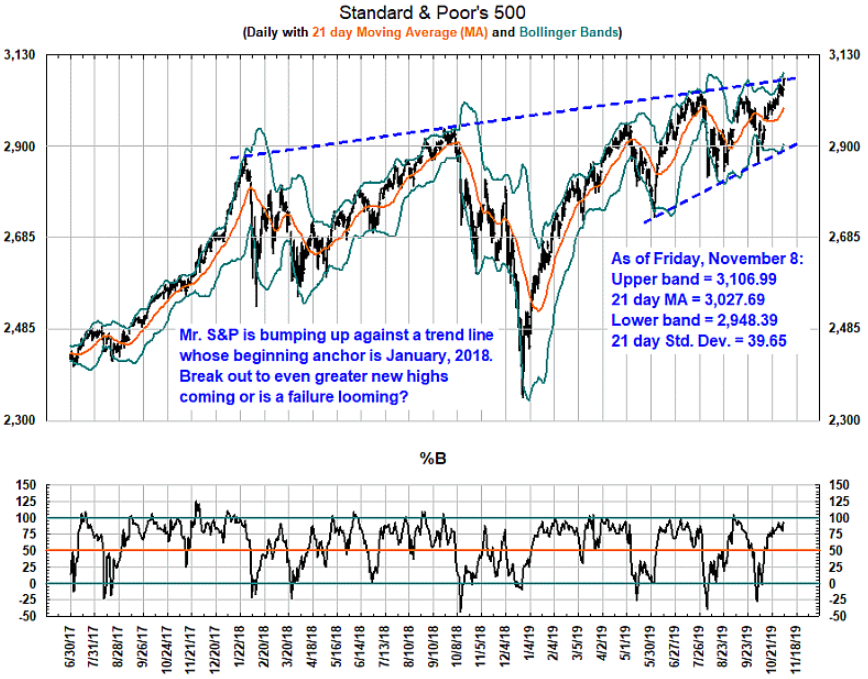
Source: The Chart Store, as of 11/8/19
2. A 15 year time horizon finds the S&P 500 smack in the middle of its growth channel...
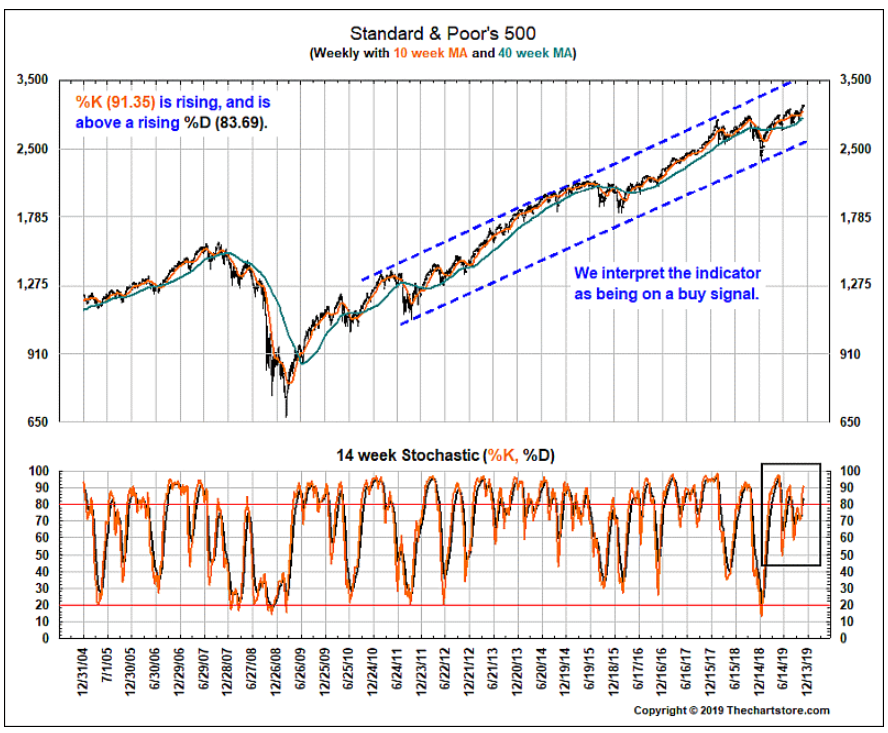
Source: The Chart Store, as of 11/8/19
3. A nation that consumes more than it makes must have a trade deficit. Will Washington ever get serious about deficits and debt again?
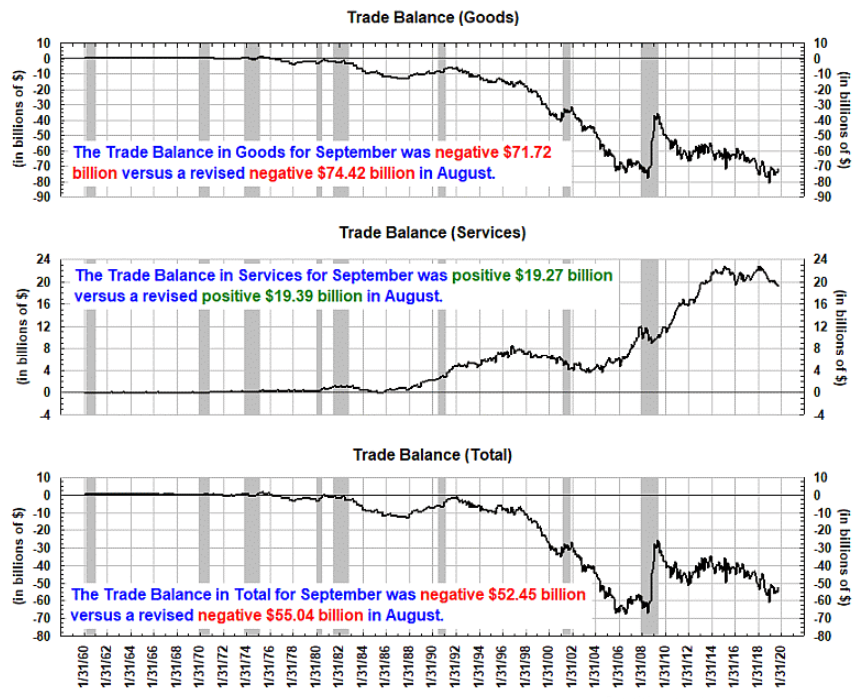
Source: The Chart Store, as of 11/8/19
4. For anyone who doubts the Fed's accommodative stance, check out their response to funding in the overnight repo markets... the Fed has already purchased over a $1/4 trillion in short-term bond purchases!
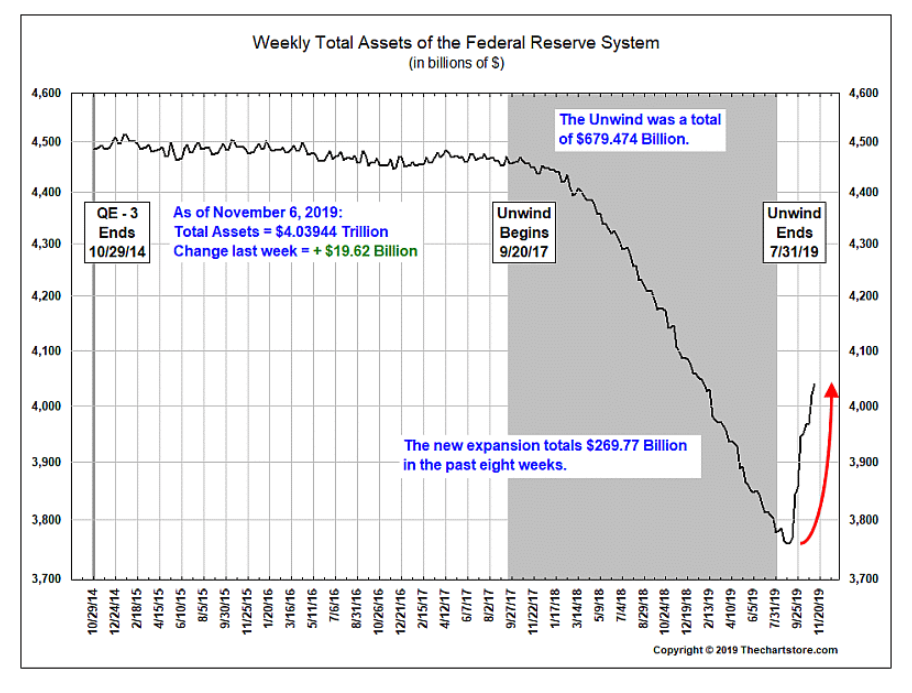
Source: The Chart Store, as of 11/8/19
5. With China's economy slowing, any sustained increase in inflation reminds me of another ghost of the 1970's; Stagflation!
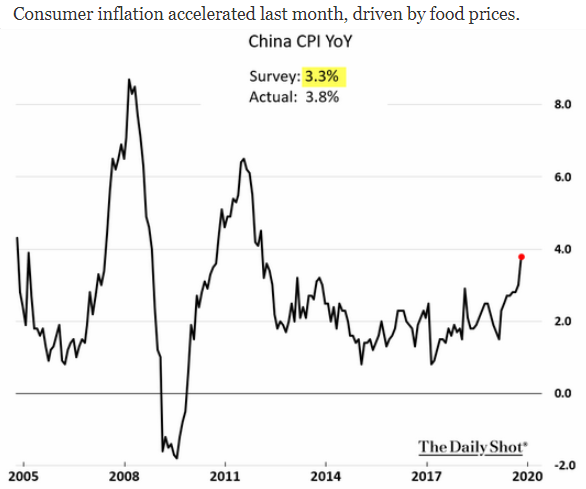
Source: WSJ Daily Shot, as of 11/11/19
6. Their PPI is already in contraction mode...
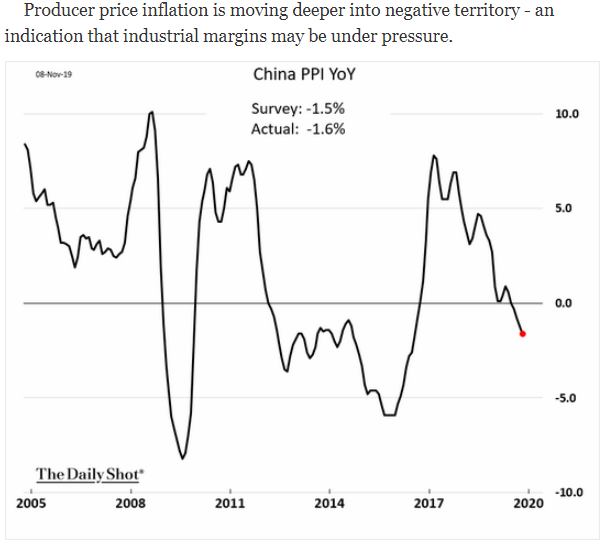
Source: WSJ Daily Shot, as of 11/11/19
7. Positive trends for global manufacturing?
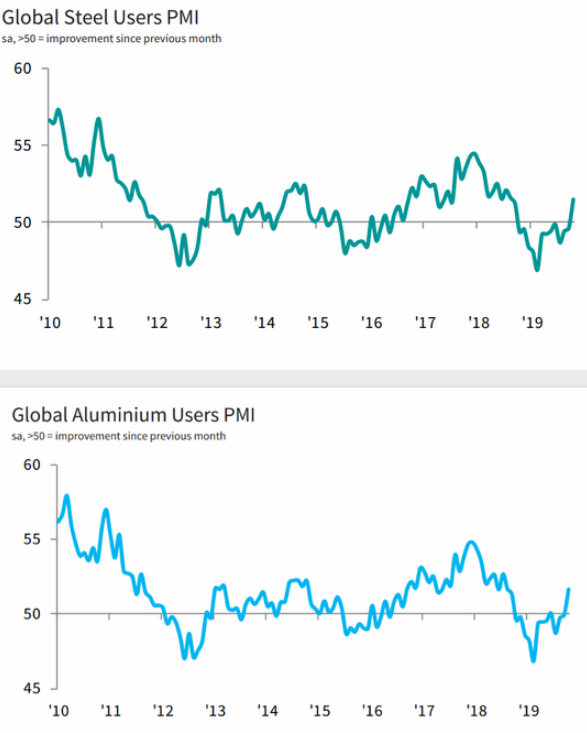
Source: WSJ Daily Shot, as of 11/11/19
If you follow us here on the BCM blog, make sure you aren't missing the action on LinkedIn! For articles, press, and more social updates, connect with us below.

Disclosure: The charts and info-graphics contained in this blog are typically based on data obtained from 3rd parties and are believed to be accurate. The commentary included is the opinion of the author and subject to change at any time. Any reference to specific securities or investments are for illustrative purposes only and are not intended as investment advice nor are a recommendation to take any action. Individual securities mentioned may be held in client accounts.