Tech has been seemingly unstoppable, even in the midst of a global pandemic, with both the S&P 500® Index's Information Technology sector and the tech-heavy Nasdaq up ~18% year-to-date. In fact, the sector is up nearly 60% from its March lows and the Nasdaq closed out last week with three consecutive all-time highs. The out-performance isn't particularly surprising in a world that's been pushed increasingly online thanks to the explosion of remote work and social distancing, but conditions are starting to resemble those from the 2000's tech bubble. But will the sector get some much needed rest when demand remains so high? Meanwhile, gold looks to have formed a "saucer" pattern and could be ready to break out, aided by historically low interest rates and a sagging USD. And the Fed looks to be easing off the (well-worn) gas pedal heading into Q3 as economic conditions improve, but will it last as Covid-19 continues to batter the South and S&P company earnings are projected to decline 44% in Q2?
1. Tech's trend channel has turned parabolic. Trends tend to persist longer than most investors think possible...
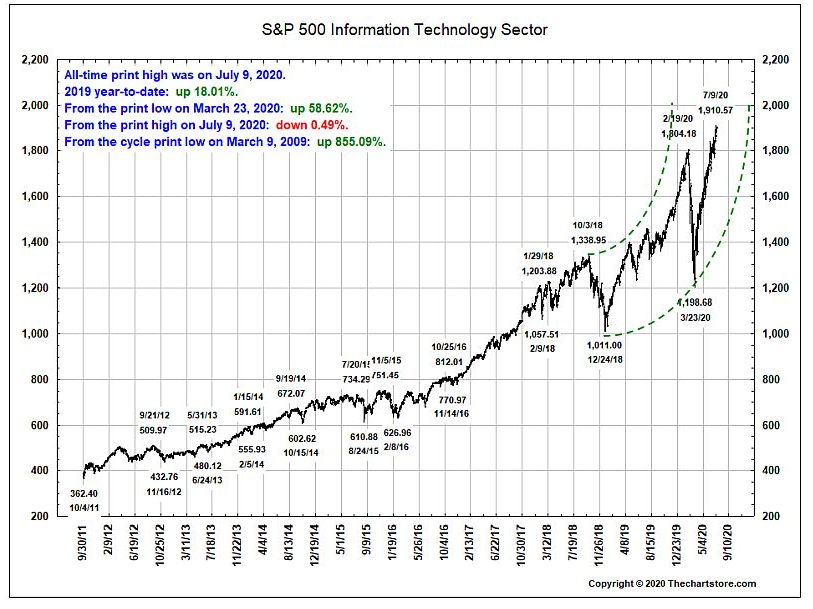
Source: The Chart Store, from 7/12/20
2. The beat goes on and on... When will the music stop? Nobody knows...

Source: The Chart Store, from 7/12/20
3. Is the tech-heavy NASDAQ poised for a well-deserved rest?

Source: WSJ Daily Shot, from 7/13/20
4. While tech may need a rest, the demand for cloud-based tech just keeps growing...

Source: WSJ Daily Shot, from 7/13/20
5. Will low interest rates and a sagging USD finally propel gold to a new high?

Source: The Chart Store, from 7/12/20
6. After a ~$3 trillion surge, the Fed's balance sheet has started to shrink as conditions improve and the need for QE subsides...for now...

Source: WSJ Daily Shot, from 7/13/20
7. While they are relatively tiny in size, why is the Fed buying bonds of foreign companies?

Source: WSJ Daily Shot, from 7/13/20
8. Canada also enjoyed a positive employment report in June...

Source: WSJ Daily Shot, from 7/13/20
Economic, social, and political upheaval soared in Q2, and we're still dealing with the fallout heading into the third quarter. For our take on what unfolded in Q2—and what we'll be keeping an eye on in Q3—read our market commentary “The Best of Times, and the Worst of Times…” by the BCM portfolio management team.

Disclosure: The charts and info-graphics contained in this blog are typically based on data obtained from 3rd parties and are believed to be accurate. The commentary included is the opinion of the author and subject to change at any time. Any reference to specific securities or investments are for illustrative purposes only and are not intended as investment advice nor are a recommendation to take any action. Individual securities mentioned may be held in client accounts.