The U.S. goods trade deficit surged 11.7% to $79.3 billion in July—the second largest deficit on record—as imports climb back to pre-pandemic levels on recovering consumer demand. Meanwhile, as U.S. equities move to wrap up their best August since the 1980’s today, thanks largely to the tech mega-caps, stocks remain extremely expensive in yet another reminder of 1999. And as the bond market continues to inch back toward “normal,” the sinking USD is giving a boost to commodity prices. Could it ultimately benefit U.S. exports too?
1. Covid makes the trade wars seem like a distant memory, but our deficit in goods is back near the record...
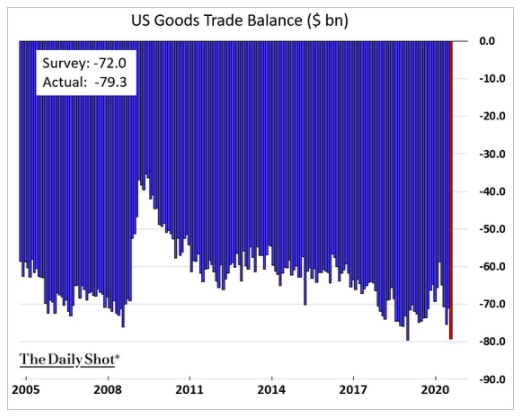
Source: The Daily Shot, from 8/31/20
2. The rate of ascent for the mega-techs keeps getting steeper. What is a sustainable?
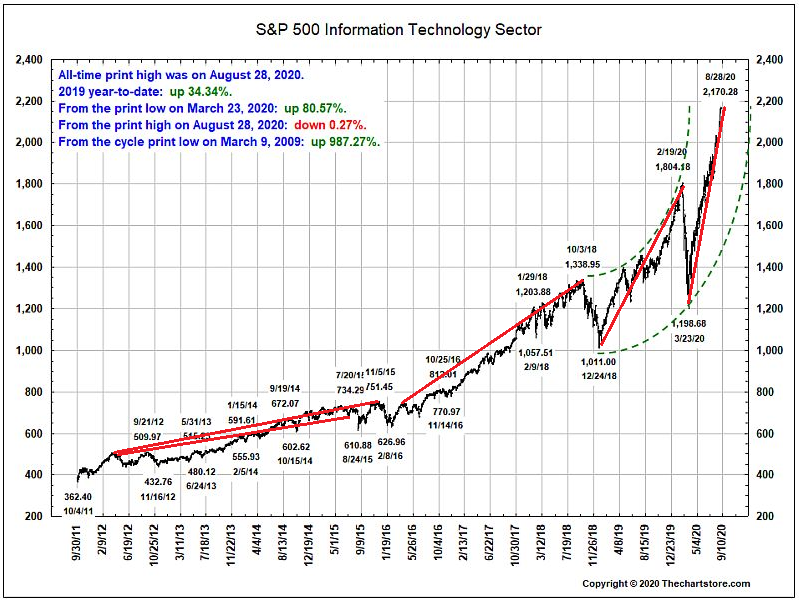
Source: TheChartStore.com, from 8/31/20
3. Yes, Covid has thrown earnings into unknown territory, but as earnings expectations regain a solid footing, reality has to set in sometime... It does feel like 1999 but no Y2K....
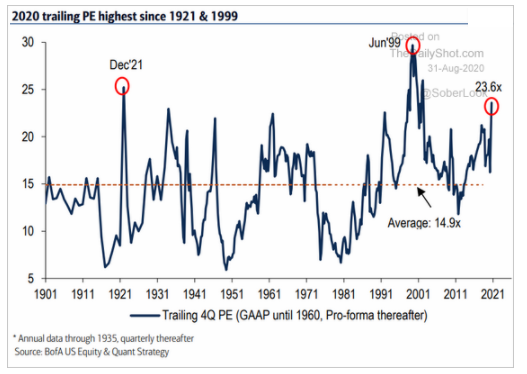
Source: The Daily Shot, from 8/31/20
4. The Fed's new policy of allowing inflation to run a bit has helped yields steepen at the long end and furthers along the "normalizing" of the shape of the curve...

Source: TheChartStore.com, from 8/31/20
5. "Yield starvation" has helped push junk bonds back to pre-pandemic highs. If only the pre-pandemic conditions and bankruptcy levels were the same...
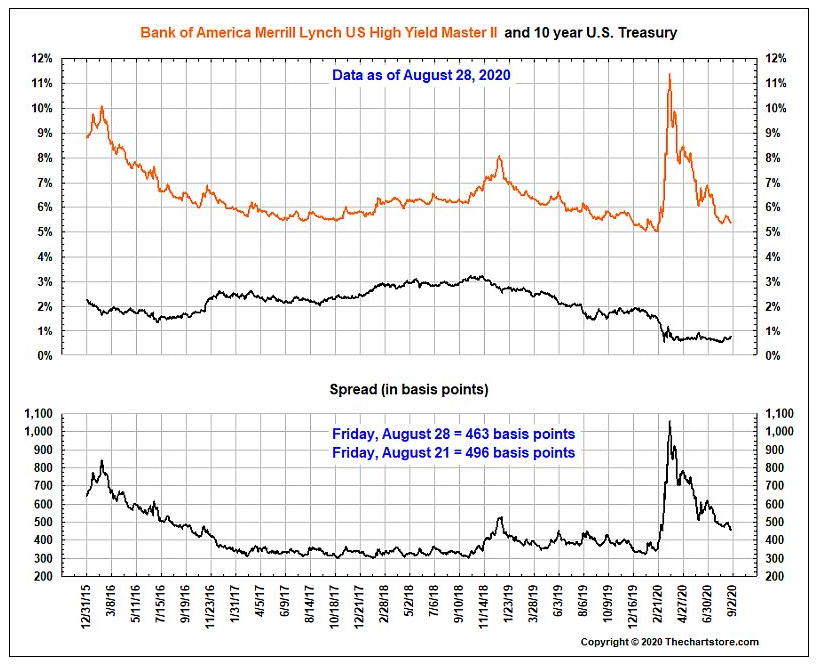
Source: TheChartStore.com, from 8/31/20
6. The USD is still falling, If it takes out the 2017 lows, are the 2014 levels in play?

Source: TheChartStore.com, from 8/31/20
7. As the USD weakens, commodity prices get a tail wind...
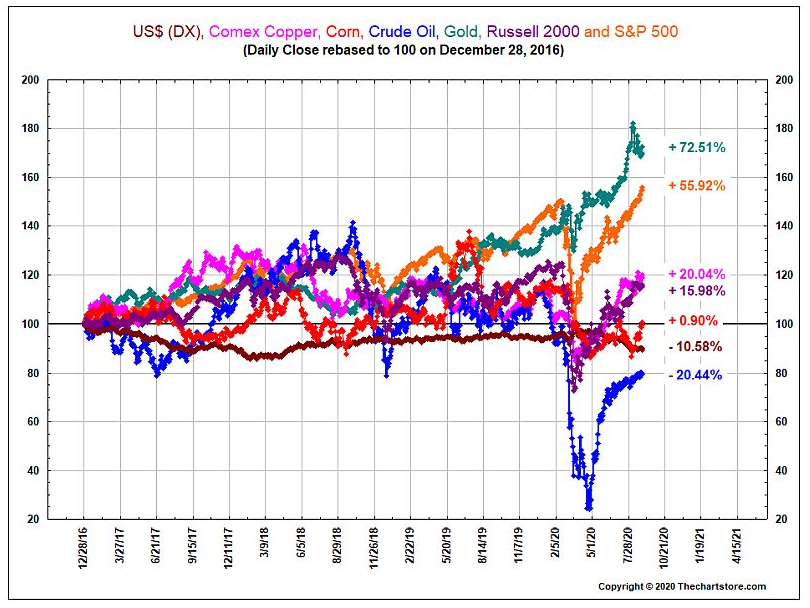
Source: TheChartStore.com, from 8/31/20
8. Industrial metal prices are at pre-pandemic levels...
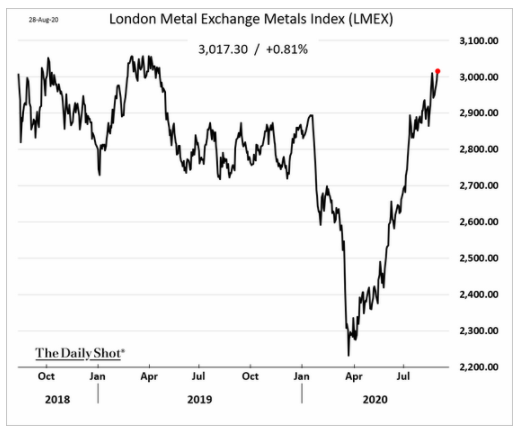
Source: The Daily Shot, from 8/31/20
9. Solid PMI data in China almost seems "too perfect", similar to their Covid numbers.

Source: The Daily Shot, from 8/31/20
Do you know someone that could benefit from our chart blog? For one, being a better investor is all about education. For weekly perspectives on dozens of market and economic charts, share the link to sign up for the Bird's Eye View Blog for a friend, colleague, or anyone that may take advantage!

Disclosure: The charts and info-graphics contained in this blog are typically based on data obtained from 3rd parties and are believed to be accurate. The commentary included is the opinion of the author and subject to change at any time. Any reference to specific securities or investments are for illustrative purposes only and are not intended as investment advice nor are a recommendation to take any action. Individual securities mentioned may be held in client accounts.