And that's a wrap on Q1. As we close out a quarter for the history books, let's hope there are better days ahead in Q2. The recent equity rebound may have convinced some optimists out there, but with confirmed cases of Covid-19 continuing to climb and the White House warning us to brace for a "very painful two weeks," we fear any celebration may be premature. Record high volatility could make for another violent swing downward... and justify a growing number of 1929 comparisons... The oil price war continues to drag on in the midst of evaporating demand, and plummeting business activity has led to an avalanche of sharply contracted Q2 GDP estimates. Soaring corporate debt and worsening business conditions has led to many ratings revisions in the bond market, which may not be a bad thing as—in our opinion—they'd been growing inflated. Finally, though there remains some question as to the accuracy, manufacturing numbers out of China indicate there may be some hope in store for a U.S. recovery not too far in future. The question is, with the world on lockdown, is there enough demand to meet the growing supply?
1. Has the stock market rebound gotten ahead of itself?

Source: WSJ Daily Shot, from 3/31/20
2. According to Bespoke Investments, March was the most volatile month ever...

Source: WSJ Daily Shot, from 4/1/20
3. A sobering comparison...

Source: TWSJ Daily Shot, from 4/1/20
4. Commodities have been decimated...realizing rolling 10-year returns only seen in the Great Depression...

Source: WSJ Daily Shot, from 3/31/20
5. Let's not forget the other Black Swan; the U.S.'s attempt to get Russia and the Saudis to the negotiating table failed...

Source: WSJ Daily Shot, from 4/1/20
6. Anyone can opine, but no one knows...

Source: WSJ Daily Shot, from 4/1/20
7. U.S. corporate debt increased by ~$200 billion in March...

Source: WSJ Daily Shot, from 3/31/20
8. The rating agencies are using the Covid-19 crisis to "more properly" rate companies...purple denotes companies that were downgraded to junk...

Source: WSJ Daily Shot, from 4/1/20
9. This is the crux of the issue...if tenants can't pay rent, how does the landlord pay the mortgage? If the landlord doesn't pay, then the banks are in trouble all over again!

Source: WSJ Daily Shot, from 4/1/20
10. I'm not sure we can count on this type of rebound as many view the official Chinese data with skepticism...but the rebound can be real and fast...A reading over 50 indicates that manufacturing activity is growing.

Source: WSJ Daily Shot, from 3/31/20
11. IHS Markit confirmed the official Chinese rebound...

Source: WSJ Daily Shot, from 4/1/20
12. In the midst of Covid-19, U.S. manufacturing has followed China's path down and, with reasoned hope, should also follow them on the way back up...
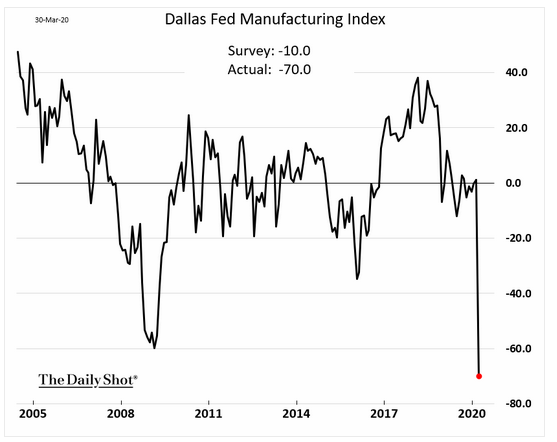
Source: WSJ Daily Shot, from 3/31/20
13. ...And the nation as a whole is feeling the effects...
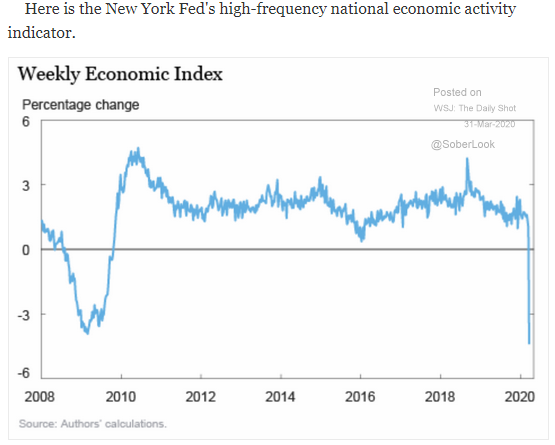
Source: WSJ Daily Shot, from 3/31/20
14. The Dallas Fed report was influenced by the oil & gas industry's decline. The Midwest fared much better in March.

Source: WSJ Daily Shot, as of 4/1/20
15. South Korea, a Covid-19 hotspot, did not show a manufacturing collapse...down, but not out!

Source: WSJ Daily Shot, from 4/1/20
As we saw above, March was the most volatile month on record. But that means massive swings in both directions (negative and positive), so could a shift from equity to fixed income potentially do more harm than good? For BCM’s thoughts, read “A Word of Caution on Fixed Income in the Current Market Environment” by BCM Assistant Portfolio Manager Brendan Ryan, CFA.

Disclosure: The charts and info-graphics contained in this blog are typically based on data obtained from 3rd parties and are believed to be accurate. The commentary included is the opinion of the author and subject to change at any time. Any reference to specific securities or investments are for illustrative purposes only and are not intended as investment advice nor are a recommendation to take any action. Individual securities mentioned may be held in client accounts.