To many people's shock, stocks ended last week slightly higher, likely thanks in part to Friday's strong jobs report. The coronavirus had yet to become a global economic threat last month though, so the March and April reports may tell a very different story... especially in light of how global manufacturing just took its hardest hit since the financial crisis. And it wasn't good news for all sectors; energy prices got clobbered and fell to multi-year lows following Russia's rejection of the proposed production cuts, and the market effects were substantial on oil producing nations. The bond market is still sending warning signals as the 10-year U.S. Treasury yield dropped below 0.7% for the first time ever, coming in at 0.676%. The Fed is doing its best to counter the slowdown with last week's emergency rate cut and continued bond purchases, but they've already unwound more than half of the QE reversal started in 2017—how much more room do they have to intervene? It may soon get tight, as even the high-yield market has gotten in on the action and has been sending warning signals of its own...
1. After all that volatility, the Dow Jones, S&P 500 and Nasdaq were up last week...
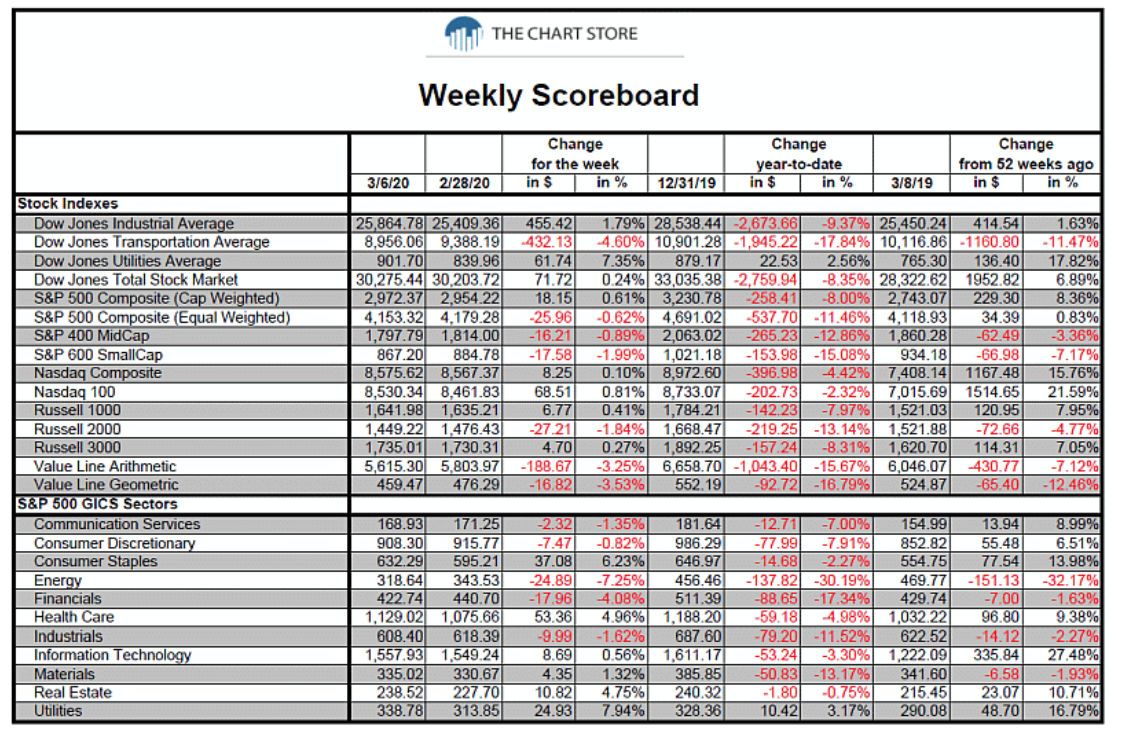
Source: The Chart Store, as of 3/6/20
2. Manufacturing last month:
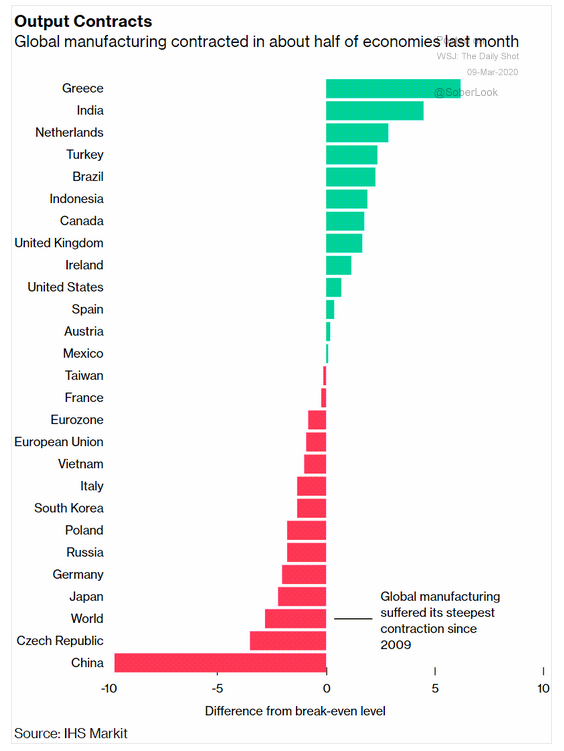
Source: WSJ Daily Shot, from 3/9/20
3. When Russia balked at production cuts, the Saudis went on the offensive. Ironically, this is just what the global economy needs... significantly lower energy costs will help the consumer and producer alike...

Source: WSJ Daily Shot, from 3/9/20
4. The collapse in oil prices (-~22% at last reading) is affecting all the oil producers' currencies and stock markets. Here is Canada:
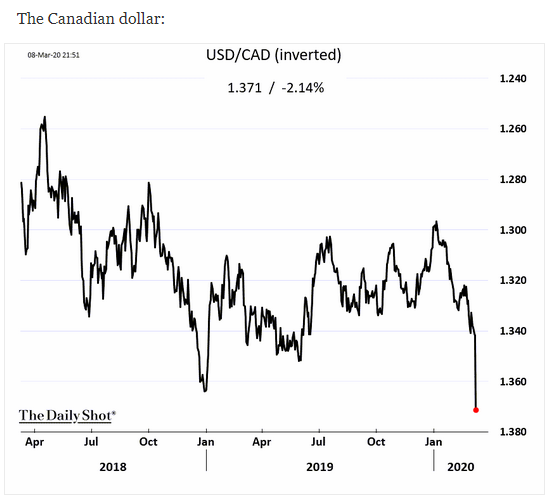
Source: WSJ Daily Shot, from 3/9/20
5. Here are many of the OPEC cartel's stock market reactions:
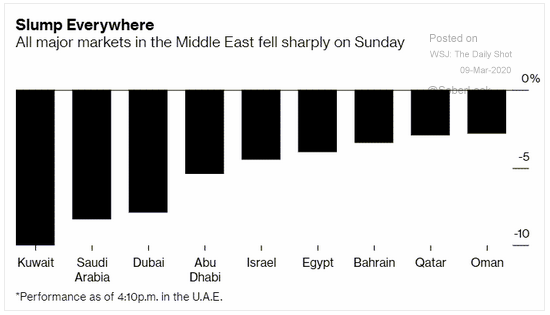
Source: WSJ Daily Shot, from 3/9/20
6. A surprise inter-meeting 50 bps rate cut and a ~$100 billion bond buying spree... will the Fed win again? What will it cost this time?
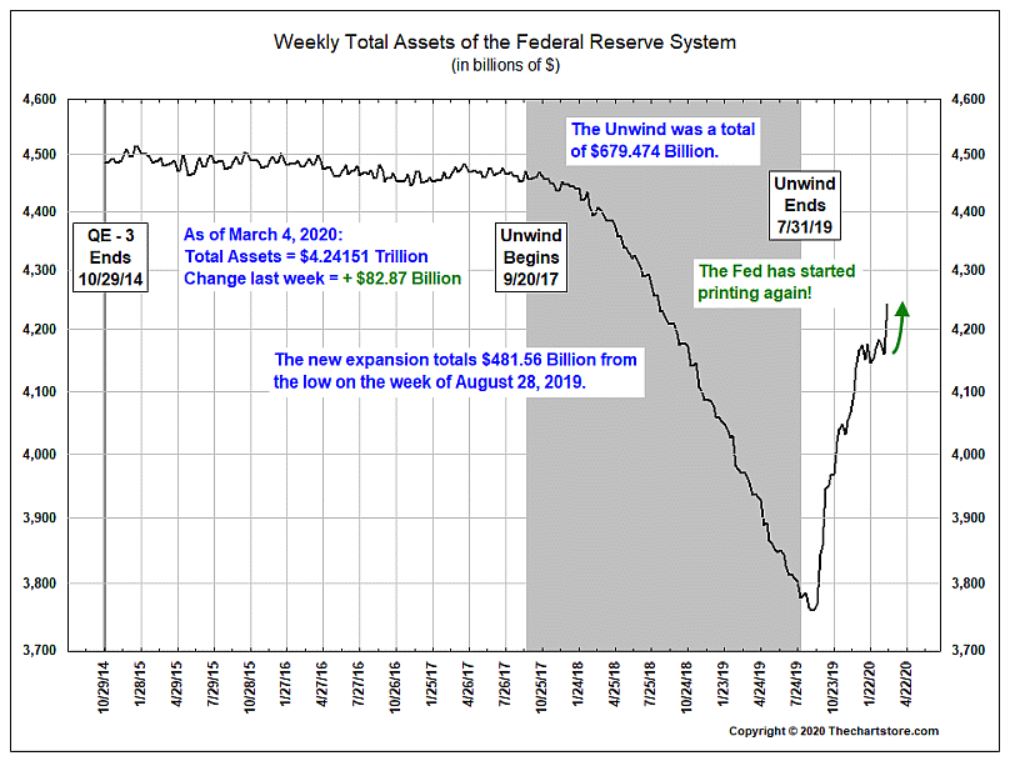
Source: The Chart Store, as of 3/6/20
7. The bond markets, despite record low rates, are expecting more cuts from the Fed. Will they get it and when?

Source: The Chart Store, as of 3/6/20
8. Our canary has stopped singing... High yield bonds have started acting like equities as they normally do in volatile markets...
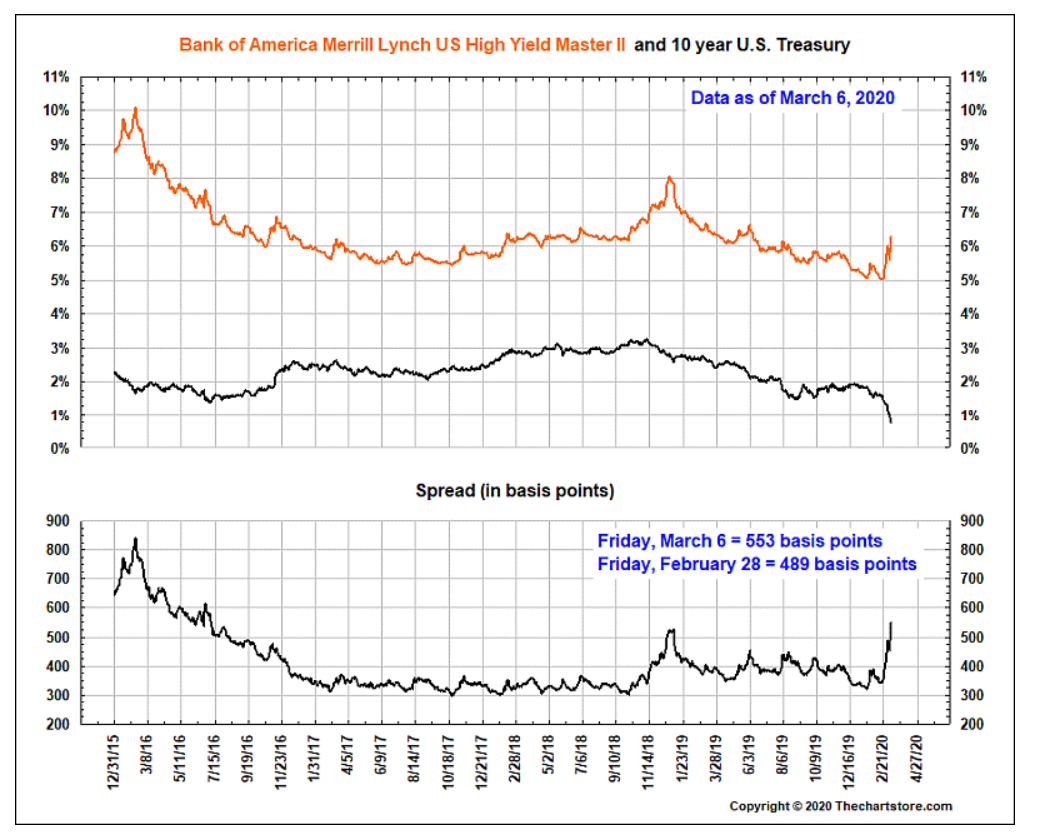
Source: The Chart Store, as of 3/6/20
9. That feels about right.
Source: WSJ Daily Shot, from 3/9/20
10. "Proper" hand washing per the World Health Organization...

Source: WSJ Daily Shot, from 3/9/20
For a review of the different kinds of market declines and their implications, read "Tactical to Practical: Understanding the Importance of Types of Market Declines" by BCM Portfolio Manager and Managing Partner Dave Haviland.

Disclosure: The charts and info-graphics contained in this blog are typically based on data obtained from 3rd parties and are believed to be accurate. The commentary included is the opinion of the author and subject to change at any time. Any reference to specific securities or investments are for illustrative purposes only and are not intended as investment advice nor are a recommendation to take any action. Individual securities mentioned may be held in client accounts.