Ready for a pulse check on one of the most unique earnings seasons on record? In the S&P 500® Index, the Utilities, Healthcare and Information Technology sectors are leading the pack in terms of out-performance, while Energy's bringing up the rear with only 20% of companies coming in above expectations. Reports from Apple and other big tech stocks are next up this week—will the quarantine-inspired surge in screen time show up in the numbers? In other news, $320 million was poured back into the Paycheck Protection Program's small business loan program last week and distribution resumes today. But, whether for technical or political reasons, are the funds failing to reach those who need them most? Consumers are certainly feeling the crunch, and their behavior is changing accordingly—how could this reshape the economy going forward? And in another blow to the energy market, active rig counts are approaching 2016 lows after six consecutive weekly drops as oil prices continue to plummet. ExxonMobil and Chevron also report earnings this week in what are sure to be interesting calls. Meanwhile, analysts have spotted a saucer pattern emerging in the gold market; what could it indicate for the commodity's future? And what could China's economic recovery indicate for ours?
1. With 1Q20 earnings about 1/4 reported, here are the results so far:
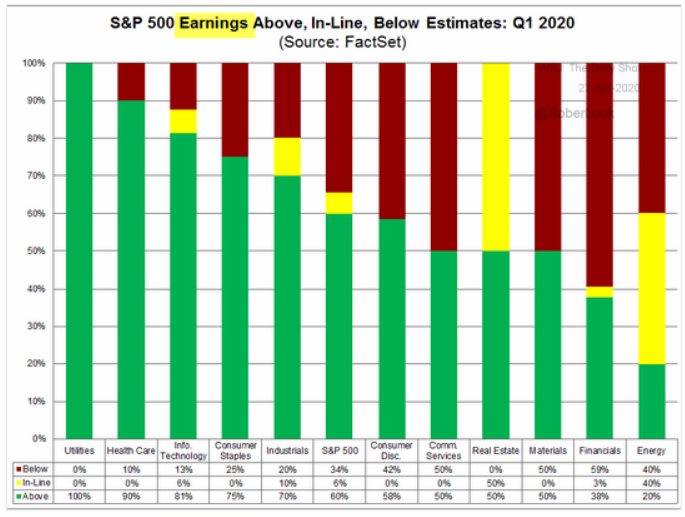
Source: The Chart Store, as of 4/24/20
2. How is consumer behavior and spending changing in the coronavirus era?

Source: Visual Capitalist, as of 4/6/20
3. This is a problem...the money is not getting to those who need it the most...
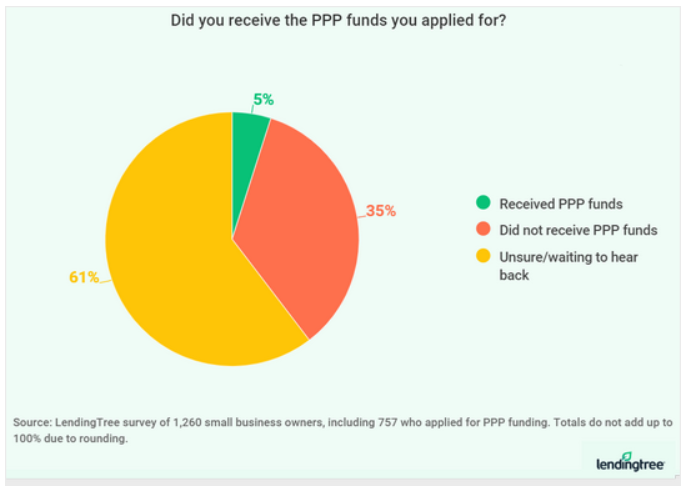
Source: WSJ Daily Shot, from 4/27/20
4. Has the PPP turned political? The states hardest hit so far have received the least...
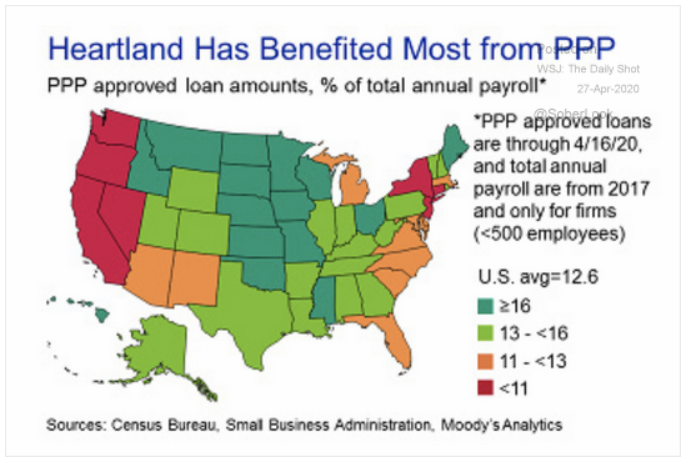
Source: WSJ Daily Shot, from 4/27/20
5. Oil prices are so low that rig count is collapsing...
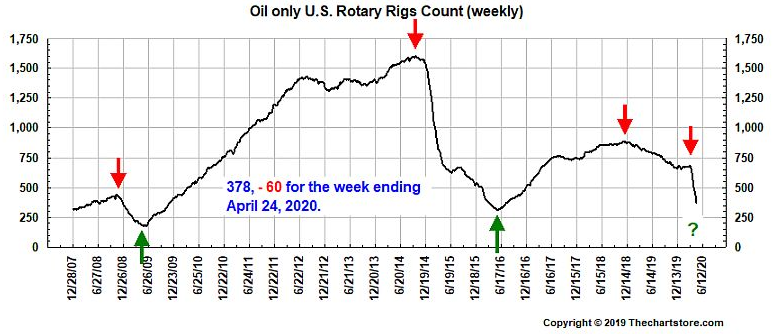
Source: The Chart Store, as of 4/24/20
6. We'll see if the technicians are right or wrong...
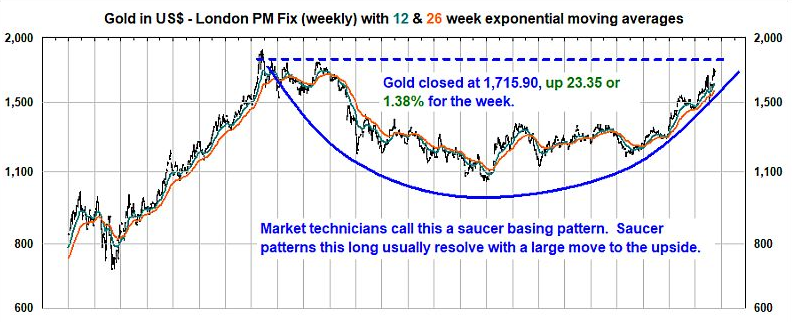
Source: The Chart Store, as of 4/24/20
7. China in January and February may offer a glimpse of how we will recover economically.
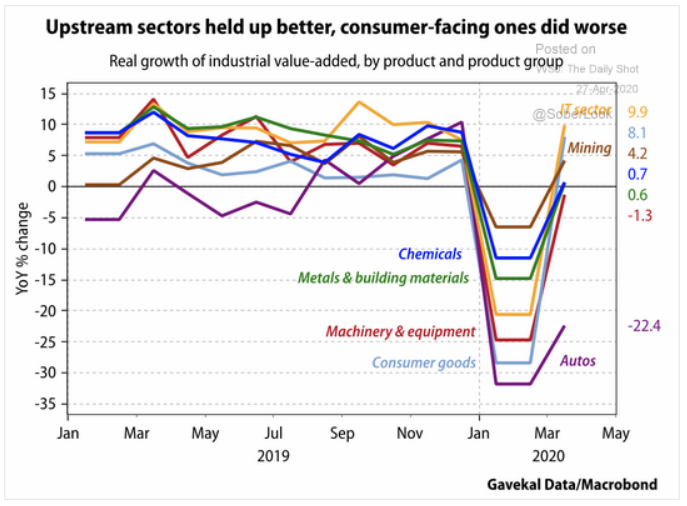
Source: WSJ Daily Shot, from 4/27/20
8. That commute to the living room can be a killer!
Source: NewYorker.com, from 4/22/20
Many investors buy “high yielding,” “high dividend” or “dividend achiever” type ETFs/funds expecting a relatively safe and stable yield, but a look back at 2007 shows us that it's not quite that simple. Read "A Caution from 2007: Beware of the Dividend in Your High Dividend ETFs & Funds" by BCM Portfolio Manager Dave Haviland to learn why.

Disclosure: The charts and info-graphics contained in this blog are typically based on data obtained from 3rd parties and are believed to be accurate. The commentary included is the opinion of the author and subject to change at any time. Any reference to specific securities or investments are for illustrative purposes only and are not intended as investment advice nor are a recommendation to take any action. Individual securities mentioned may be held in client accounts.