~4.3 million more Americans filed for unemployment this week, and while that brings the quarantine-era total to ~26 million, inching us closer to a 20% unemployment rate, new claims are trending downward. Unfortunately, so are our manufacturing numbers which have slipped well into contraction territory and are on a path to revisit their financial-crisis lows. Meanwhile, as the Nasdaq's market cap hit a historic milestone, investors are turning a critical eye to companies, their balance sheets (and subsequent preparedness to ride out the lean times), and their credit worthiness. Are more downgrades on the horizon? Inflation may be, as the massive wave of QE just pushed the growth rate of the U.S. broad money supply to its highest point in modern history! And there's more stimulus on the way too; the House passed another $480 billion in coronavirus relief funding yesterday and Congress is already in talks on a Phase 4 deal—where's it all going? Finally, over in China, investors are piling into defensive positions. But with yields on money-market funds falling, is this "flight to safety" all that safe?
1. Would you ever think 4.3 million people losing their jobs in a week was an improvement?
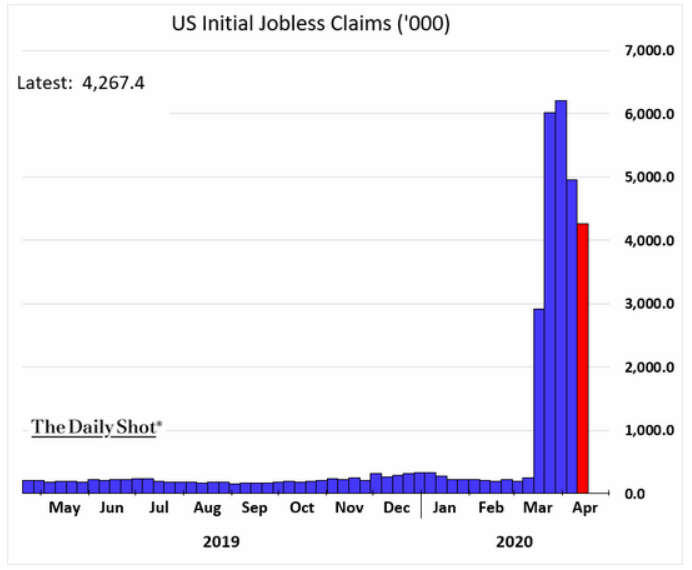
Source: WSJ Daily Shot, from 4/24/20
2. This gives historical perspectives. Unfortunately, it doesn't include the 4.3 million from last week...
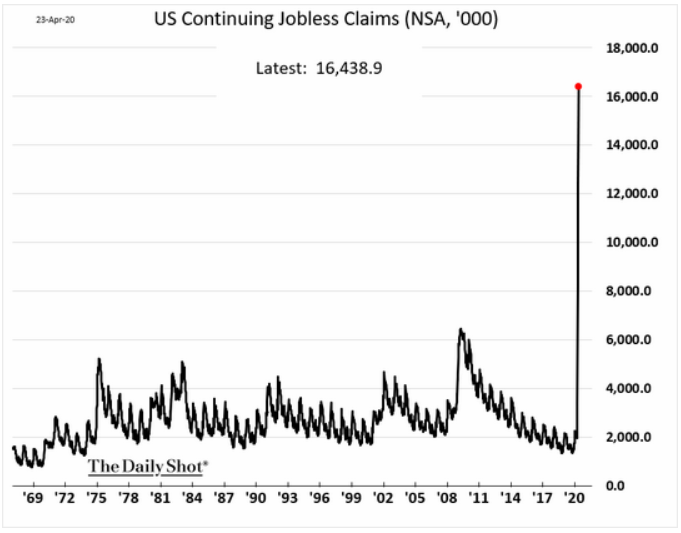
Source: WSJ Daily Shot, from 4/24/20
3. U.S. manufacturing is approaching the 2009 lows.
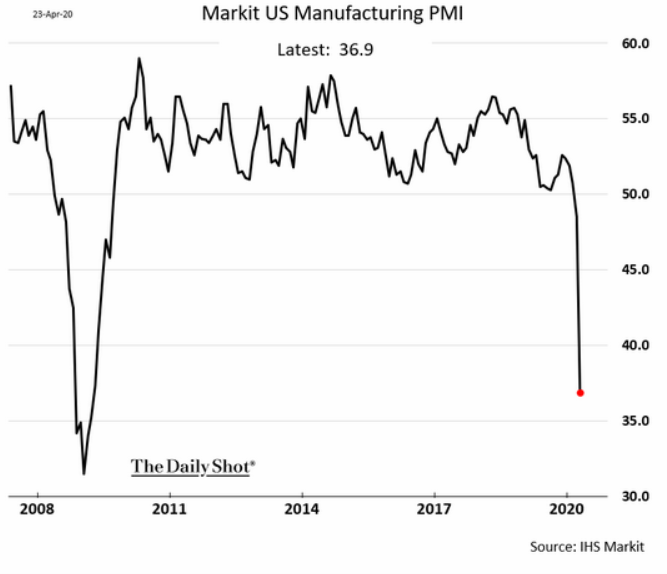
Source: WSJ Daily Shot, from 4/24/20
4. For a moment there, the Nasdaq was worth more than the rest of the world's stocks...combined!
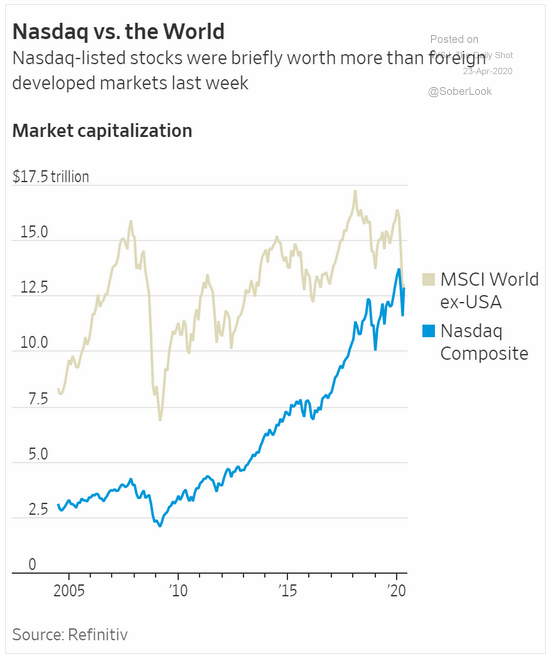
Source: WSJ Daily Shot, from 4/22/20
5. Will this crisis bring an active management resurgence? Passive indexing rewards good and bad companies alike, which matters less in a roaring bull market...
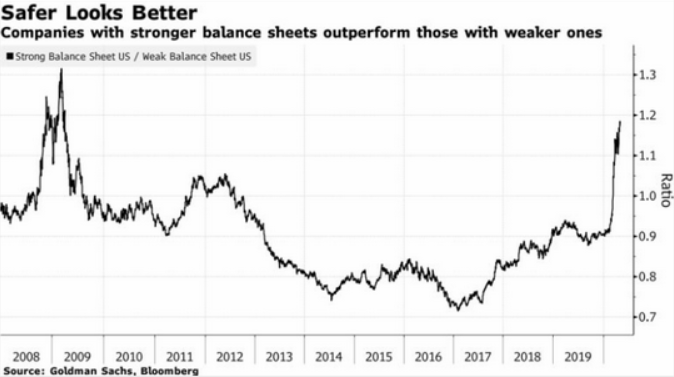
Source: WSJ Daily Shot, from 4/24/20
6. How many companies will be downgraded or worse?
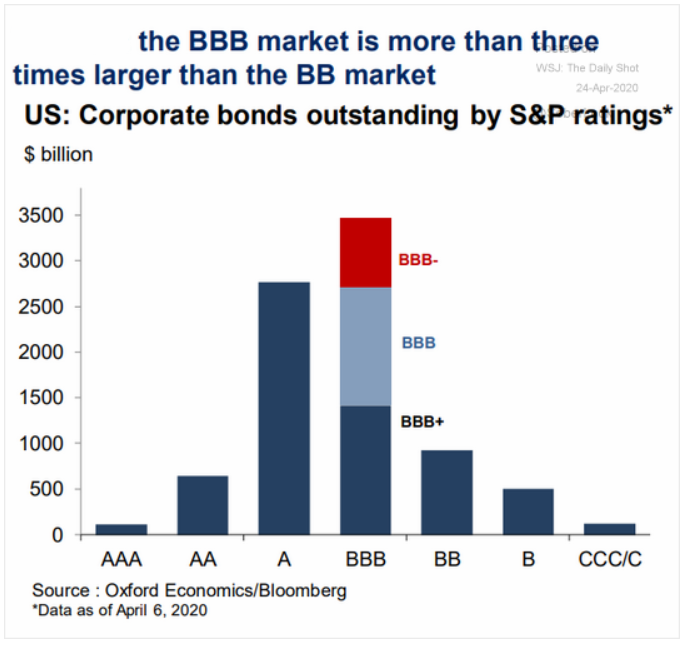
Source: Oxford Economics, as of 4/6/20
7. A harbinger for future inflation?
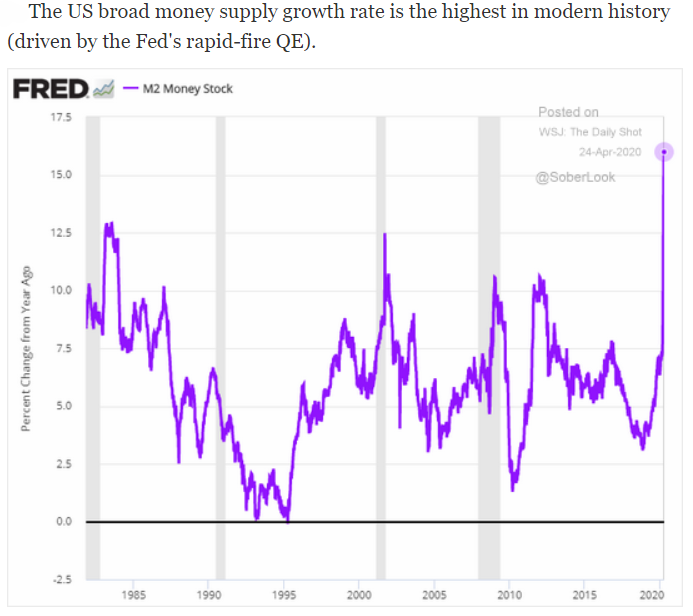
Source: WSJ Daily Shot, from 4/24/20
8. Down, but not out...
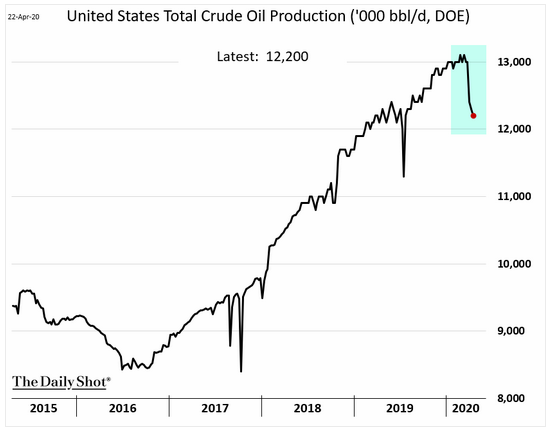
Source: WSJ Daily Shot, from 4/23/20
9. What's in this week's interim stimulus bill?

Source: WSJ Daily Shot, from 4/23/20
10. The best intentions do not always become reality...

Source: UBS Research, from 4/22/20
11. As a people, the Chinese are definitely in risk-off mode for the moment.
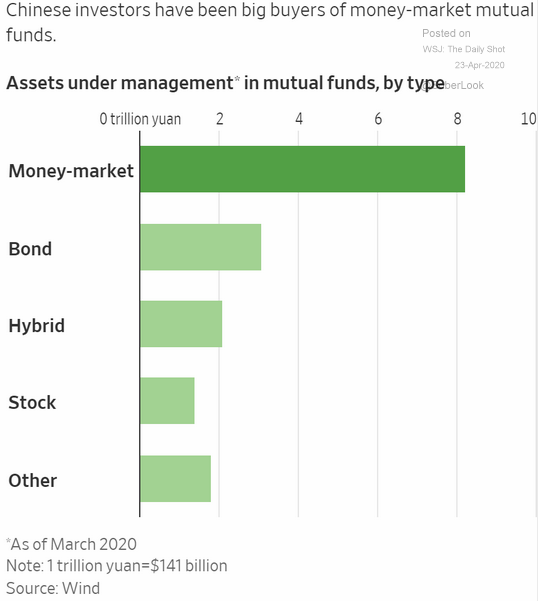
Source: WSJ Daily Shot, as of 3/31/20
12. Yet with yields falling, how long will the defensiveness last?
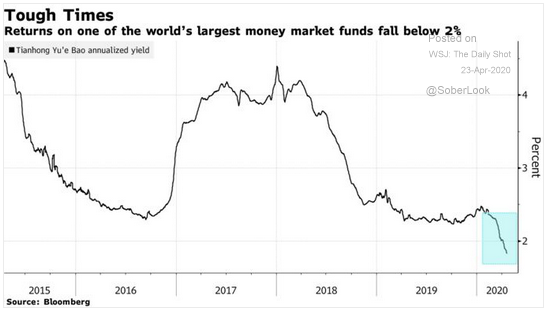
Source: WSJ Daily Shot, from 4/23/20
13. Perhaps a more modest stimulus package is playing a role...
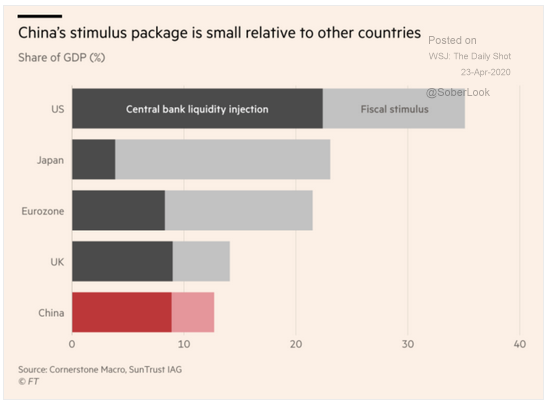
Source: Financial Times, from 4/23/20
14. Japan's manufacturing numbers were better than most countries...
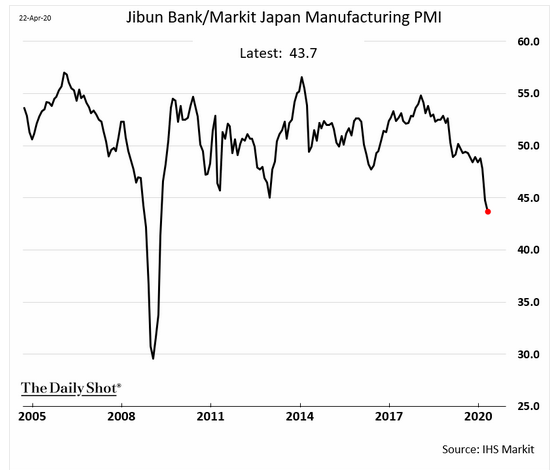
Source: WSJ Daily Shot, from 4/23/20
15. While data from China may be suspect, if enough testing is done we would see how many people have Covid-19 but show no symptoms.
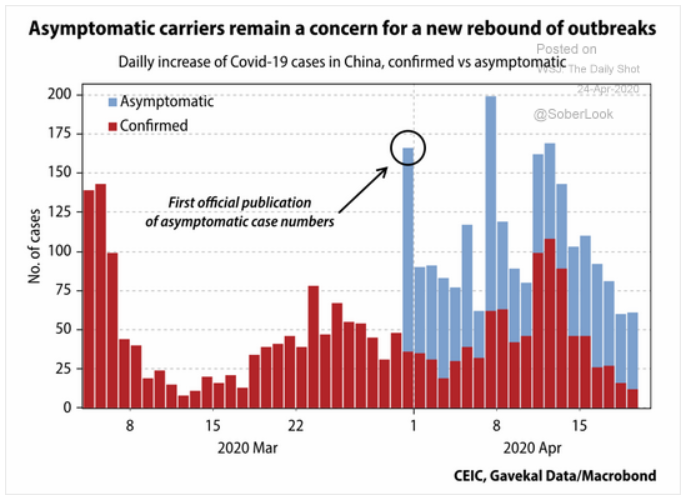
Source: WSJ Daily Shot, from 4/24/20
16. To the entire medical field and all first responders, we can't thank you enough!
Source: WSJ Daily Shot, from 4/24/20
Many investors buy “high yielding,” “high dividend” or “dividend achiever” type ETFs/funds expecting a relatively safe and stable yield, but a look back at 2007 shows us that it's not quite that simple. Read "A Caution from 2007: Beware of the Dividend in Your High Dividend ETFs & Funds" by BCM Portfolio Manager Dave Haviland to learn why.

Disclosure: The charts and info-graphics contained in this blog are typically based on data obtained from 3rd parties and are believed to be accurate. The commentary included is the opinion of the author and subject to change at any time. Any reference to specific securities or investments are for illustrative purposes only and are not intended as investment advice nor are a recommendation to take any action. Individual securities mentioned may be held in client accounts.