The U.S. political landscape isn't the only thing that grew more rocky in 2019; S&P 500 volatility and drawdown frequency have increased significantly in the last decade, with days spent with a 3%+ drawdown up almost fivefold over the early 2010's. Could this be part of the "mini-cycle" phenomenon we wrote about last month? And analysts may be seeing even more volatility approaching, as the CBOE SKEW Index—a measure of the perceived probability of outlier equity returns—has surged this month to a 2019 high. While that may paint an ominous picture, household assets are growing and also setting records, so it's not all bad news. And they say the early bird gets the worm, but it looks like the night owls have been coming out ahead this decade—at least when it comes to the Nasdaq 100. Finally, while Facebook defended its security and encryption practices in front of the Senate Judiciary Committee yesterday, do you think they made any mention of the proliferation of fake accounts? ~400 million is nothing to sneeze at...
1. Is this the new normal?
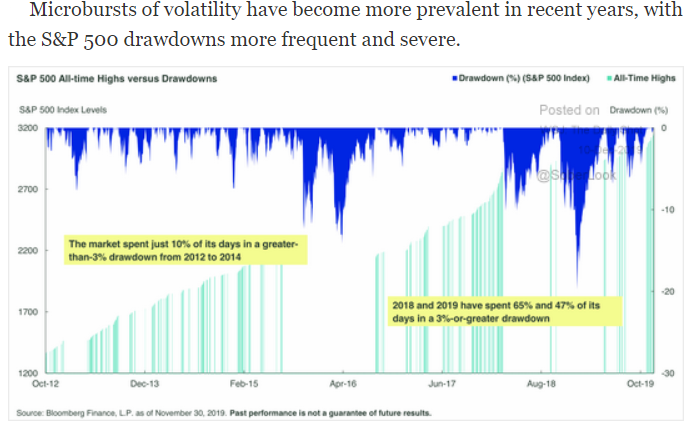
Source: SPDR Americas Research, from 12/10/19
2. If it is, many are preparing for the next one. Are you?
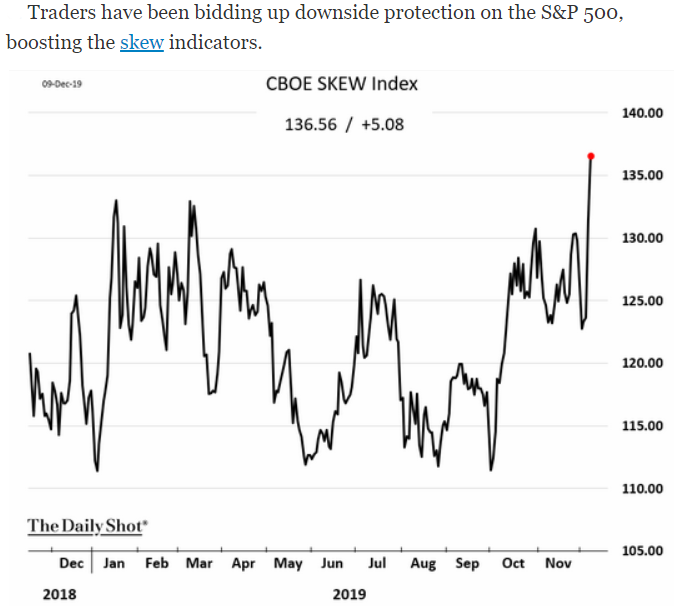
Source: WSJ Daily Shot, from 12/9/19
3. Interesting...

Source: WSJ Daily Shot, from 12/11/19
4. The record economic expansion we are enjoying is helping Americans in many ways:
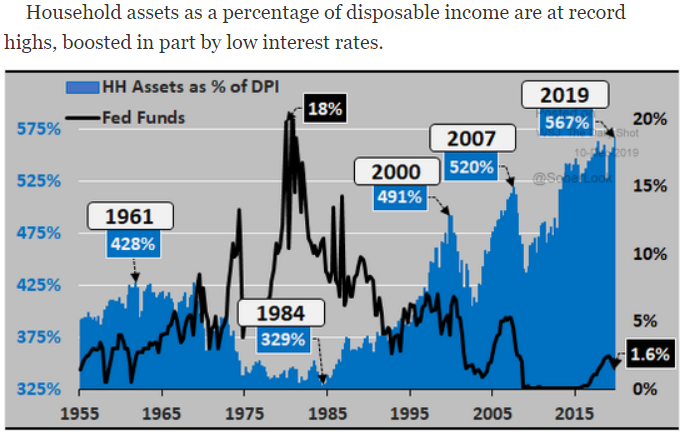
Source: Economica, from 12/9/19
5. Slowing growth and rising inflation... we used to call that stag-flation...
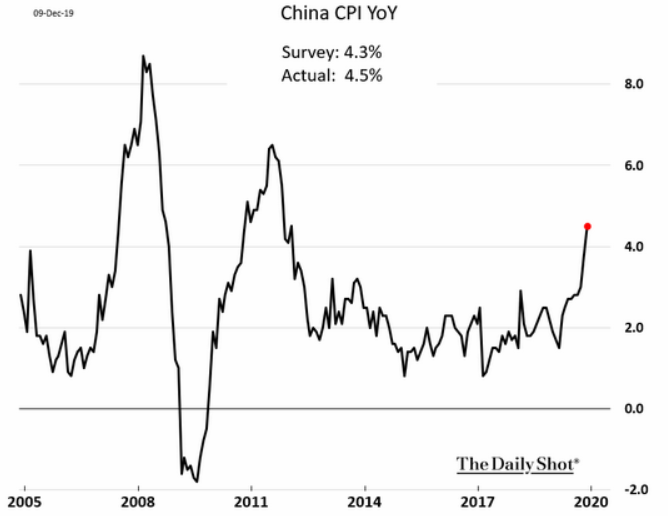
Source: WSJ Daily Shot, from 12/9/19
6. QE "phase-out" is contributing to the normalization of rates...
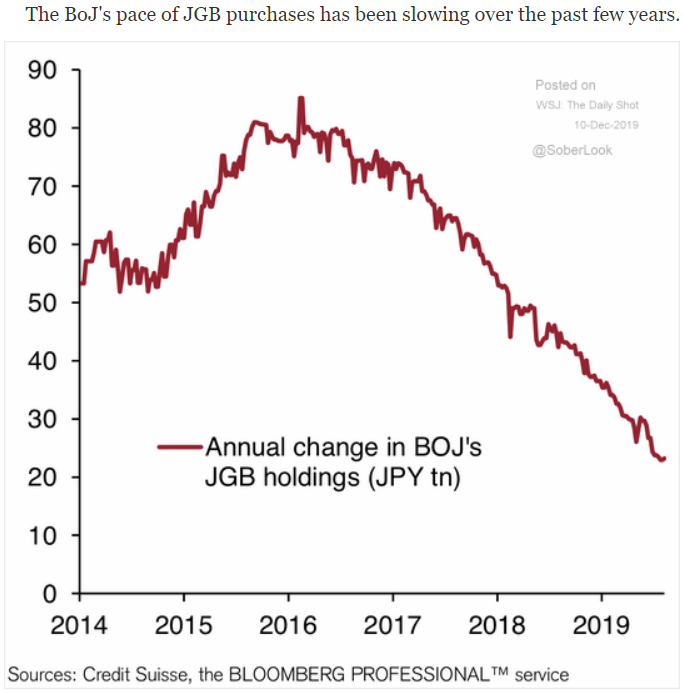
Source: WSJ Daily Shot, from 12/9/19
7. Back to positive rates!
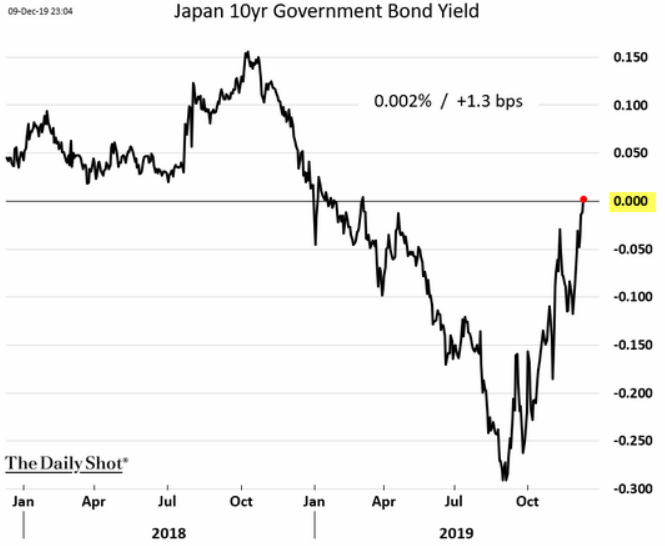
Source: WSJ Daily Shot, from 12/9/19
8. I'm willing to bet your local coffee shop didn't lower prices in April or October...
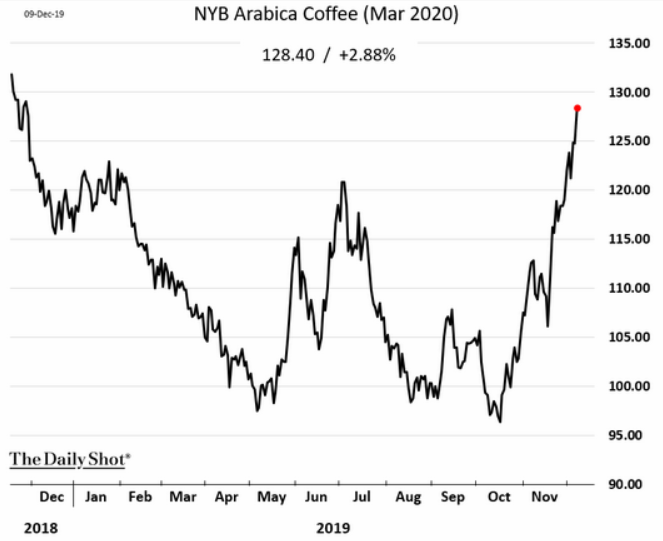
Source: WSJ Daily Shot, from 12/9/19
9. If they know they exist, why not close them?!
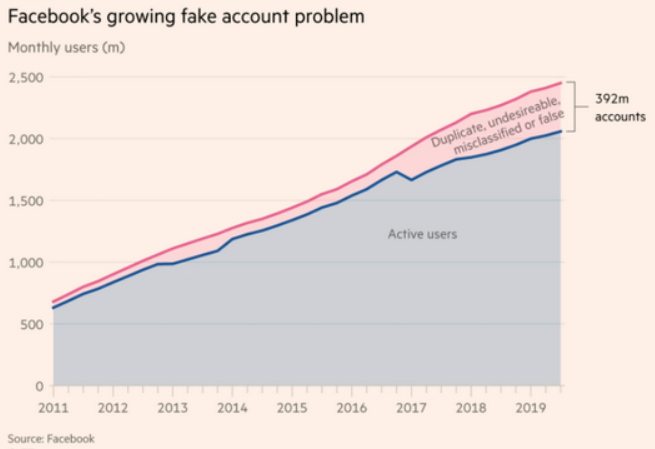
Source: Financial Times, from 12/10/19
Although 2019 has seen many all-time highs from the S&P 500, the index spent nearly half the year in a 3%+ drawdown, and—as chart #1 above shows—they're becoming more frequent. But what does that mean for risk management? For our perspective, read "Our Take on Volatility: When You Are More Likely to Realize Good Investment Outcomes" by BCM Assistant Portfolio Manager, Denis Rezendes, CFA.
Disclosure: The charts and info-graphics contained in this blog are typically based on data obtained from 3rd parties and are believed to be accurate. The commentary included is the opinion of the author and subject to change at any time. Any reference to specific securities or investments are for illustrative purposes only and are not intended as investment advice nor are a recommendation to take any action. Individual securities mentioned may be held in client accounts.


