Fireside Charts: Energy Sector Runs Out of Steam, Tanking Business Activity in China, Yield Curve Inverts Again
February 21, 2020While the S&P 500 has remained fairly "energized" throughout recent periods of geopolitical and epidemiological uncertainty, the index's energy sector has failed to live up ...
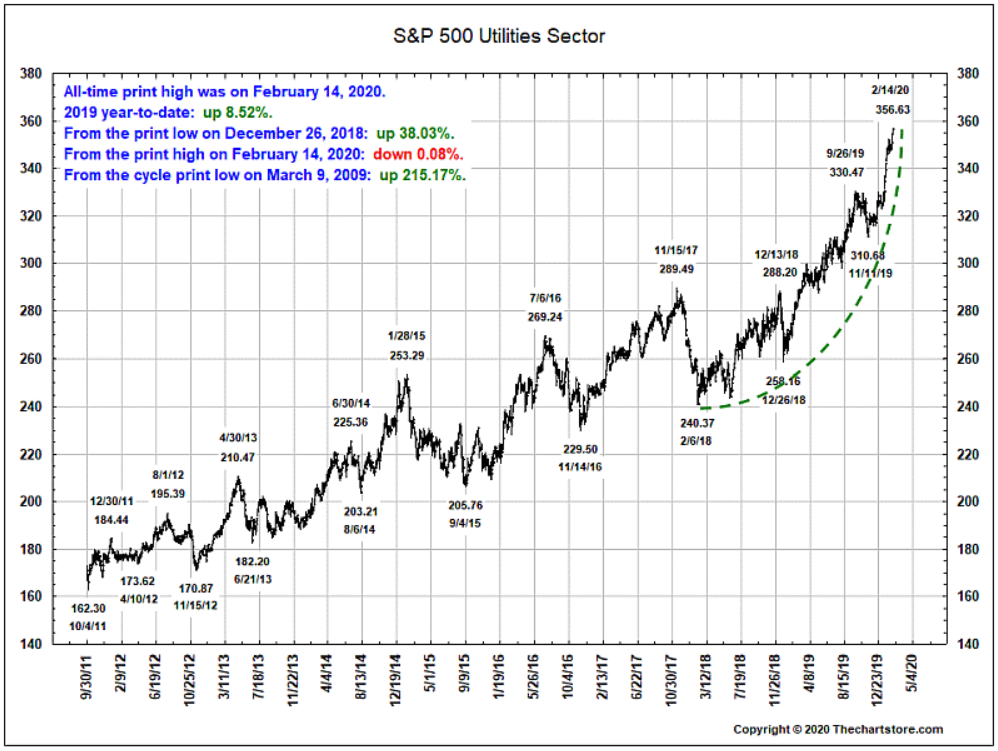
Fireside Charts: The S&P 500's Value Concentration, Utilities Hit Record High, and a Look at Bond Market Signals
February 19, 2020The S&P 500 had a record year in 2019 and may still be hovering around all-time highs, but it looks like (when it comes to 4Q19 earnings per share growth, at least) credit is ...

Fireside Charts: Farm Bankruptcies Hit 8-Year High, Coronavirus Confusion, and Slowing Growth
February 14, 2020Happy Valentine's Day, Fireside Charts readers! If your wallet's feeling a little light this week, you aren't alone; U.S. farm bankruptcies keep climbing and hit an eight-year ...

Fireside Charts: U.S. Job Openings Drop 14% YoY, The Big Get Bigger, and the Velocity of Money Hits Six+ Decade Low
February 12, 2020The number of U.S. job openings fell short of expectations to hit a two-year low in December, reigniting fears of a softening economy. This marks the second significant decline in a ...
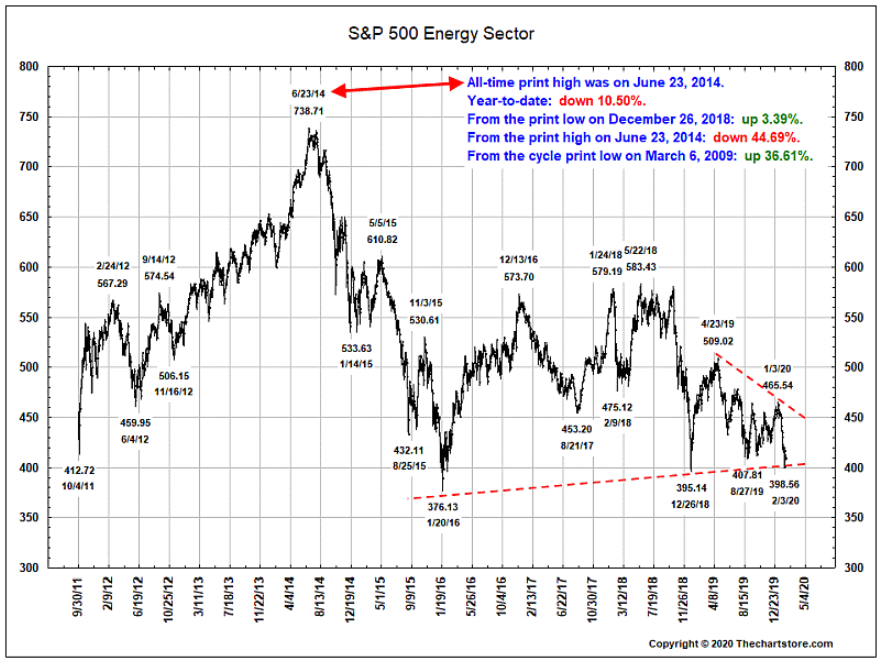
Fireside Charts: Energy Sector Weakness, MBS Yields Hit ~4-Year Low, And Coronavirus Transmission Finally Slows
February 10, 2020While the S&P 500 is as "energized" as ever, the energy sector itself has been struggling; it was the worst performer in 2019 and declined 11% in the past month, making it the only ...
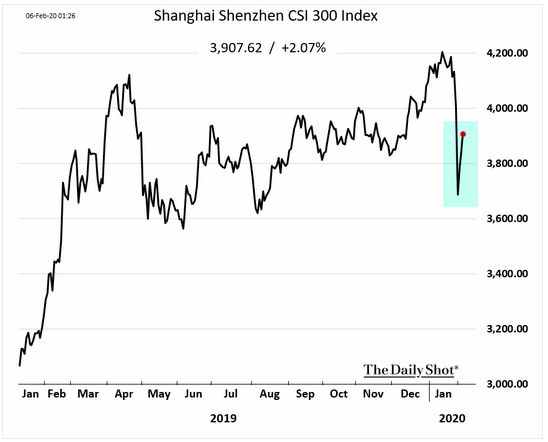
Fireside Charts: Cyclical Markets, Reevaluating 'Investment Grade' Debt, and an Update on China
February 7, 2020It's no secret that the S&P 500 has dominated in the past ten years, rising over 375% between 3/9/09 and 12/31/19 and cruising to another all time high this week on news of ...
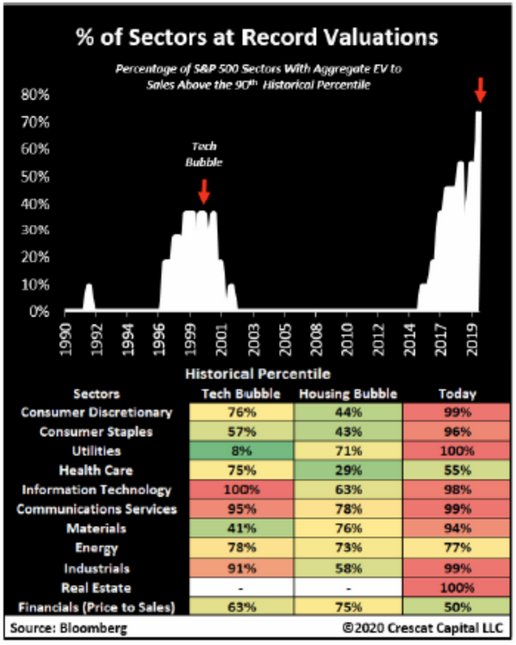
Fireside Charts: Record Sector Valuations, Small Caps Fail to Keep Up, and a Look at Bonds During the SARS Epidemic
February 5, 2020Despite ongoing coronavirus fears (or perhaps because they've finally been offered some relief—thanks

Fireside Charts: Market Movement, Regional Activity Updates, and a Look at EM Manufacturing
February 3, 2020Friday was a dark day in the markets that saw the Dow and the S&P wipe out their gains for the year. Utilities have surged as investors have begun seeking safety and regional PMI's ...

Fireside Charts: Continued Coronavirus Fallout, Some Perspective on U.S. GDP, and a Look at the Eurozone
January 31, 2020While the eastern U.S. and even Germany look to have (finally) turned a corner on manufacturing, China's manufacturing PMI remains firmly on the line between growth and contraction. If ...
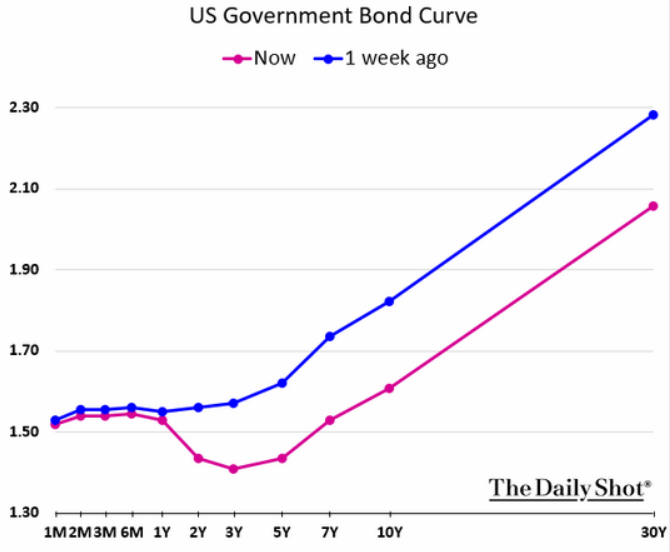
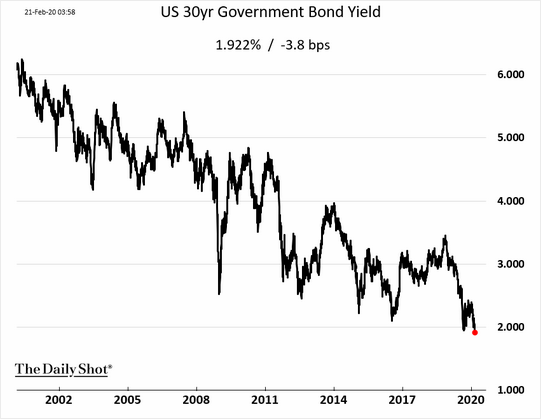
Fireside Charts: Another Yield Curve Inversion, More Coronavirus Fallout, and an Update on Manufacturing
January 29, 2020Much was made of 2019's yield curve inversions and the signal's penchant for predicting recessions, but a relatively strong Q3 earnings season and continued dominance from the S&P ...