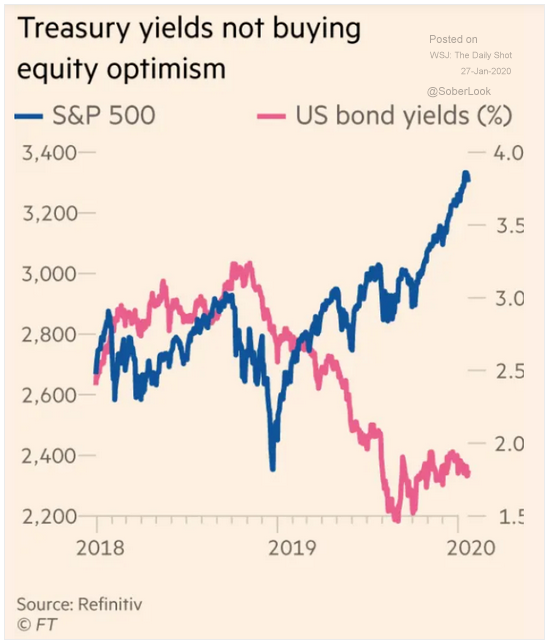
Fireside Charts: Treasuries & Equities Diverge, Conference Board LEI Turns Negative, and Coronavirus Infects the Markets
January 27, 2020Equities and Treasuries are sending different signals these days, with treasury yields painting a grimmer picture than the ever-surging S&P 500. The often synchronous measures ...
Fireside Charts: Good News for the U.S. Farmer, Coronavirus Affects Markets, and Pleasant (and Surprising) Manufacturing News
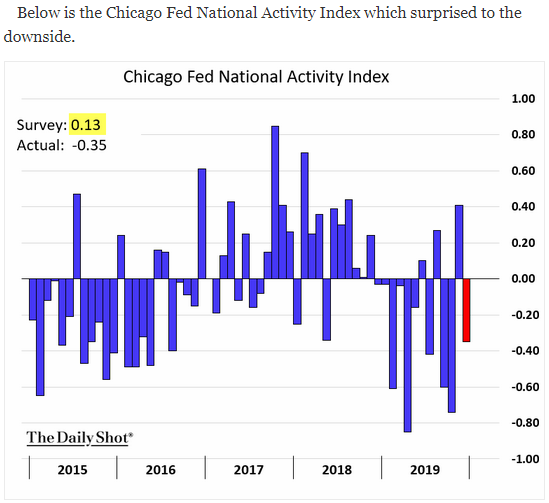
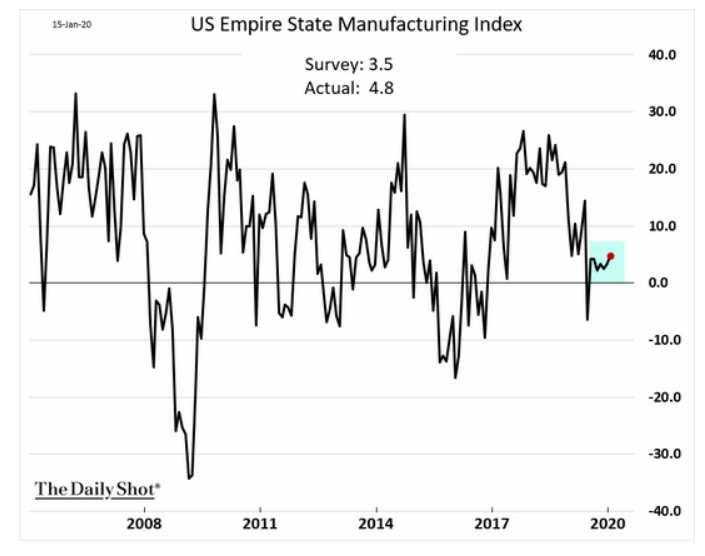
January 24, 2020While we've seen some promising signs on economic activity (and even manufacturing, finally) out of New York and ...
Fireside Charts: 2020 Projections, a Review of the Decade, and What's Captured Investor Interest?
January 22, 2020As we settle into the second week of earnings season, let's take a look at what the analysts see coming in the next year. 4Q19 forecasts are predicting earnings will be down ...
Fireside Charts: Another Record For the S&P 500 and Some Overdue Good News on Manufacturing
January 17, 2020The S&P 500 sailed through the 3,300 mark for the first time yesterday to clinch yet another record, thanks in large part to solid December retail numbers, a strong start to ...
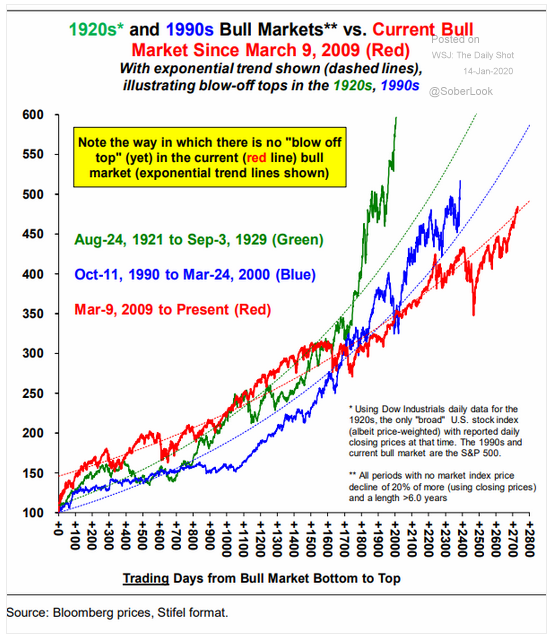
Fireside Charts: The S&P 500 Revisits the '90s, How Last 3 Bull Markets Compare, and a Look at Inflation
January 15, 2020The S&P 500 hit 22 new all-time closing highs in 2019 and just continued its record setting into 2020; the top five public U.S. ...
Fireside Charts: EPS Projections Unchanged, Nasdaq Composite Chases S&P 500, Junk Bond Yields Disappoint
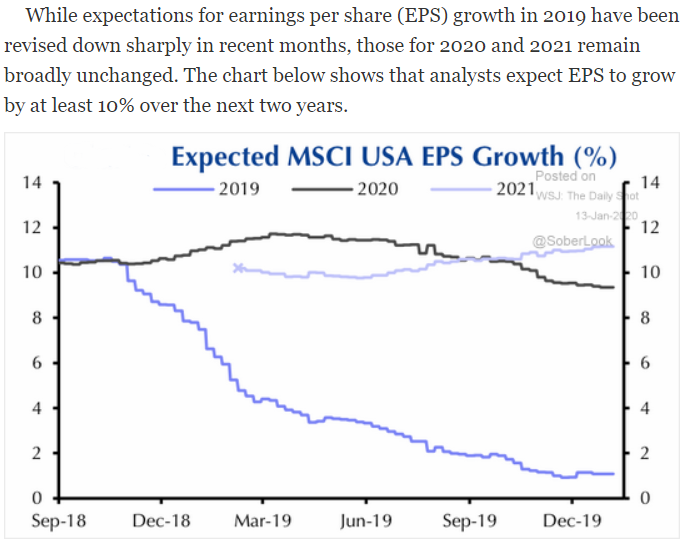
January 13, 2020Earnings season kicks off this week and analysts' expected EPS growth in the MSCI USA index is currently at 10%+ through 2021. Strong growth from tech firms is also helping boost the Nasdaq Composite Index, which just saw its market value climb to over half of that of the S&P 500. Over in the bond market, 10-year U.S. Treasury (UST) yields look to be revisiting patterns from 2012 and 2016; could they be poised to rise after hovering near historic lows for much of the last year? Finally, it's resolution season out there—can ...
Fireside Charts: 2020 Equity Expectations Soar, U.S. Corporate Bonds Set Record Low, Update on USD/CNY
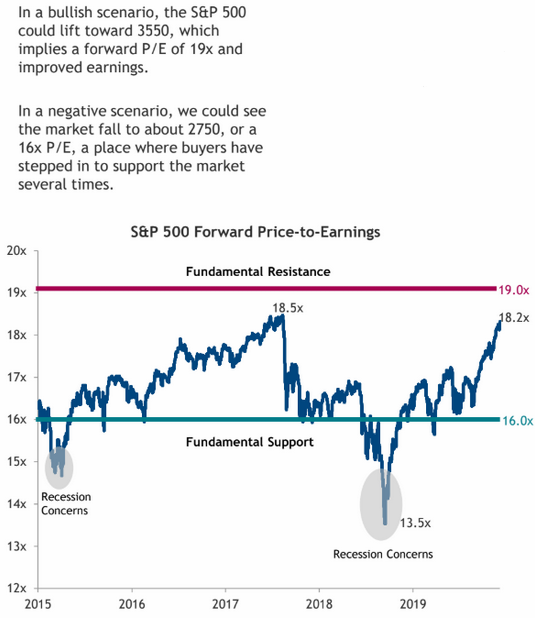
January 10, 2020What are your hopes and expectations for 2020? Corporate earnings markets are certainly feeling optimistic, as demonstrated by the historic highs of the forward P/E ratio, but earnings season will have to deliver if we hope to keep the good times rolling. Meanwhile, the bond market looks to already be experiencing some hardship, with the Barclays U.S. Corporate Bond (BBCB) Index yield-to-duration ratio kicking off 2020 by sinking to a record low. How do your clients feel about taking on greater duration-risk in exchange for ...
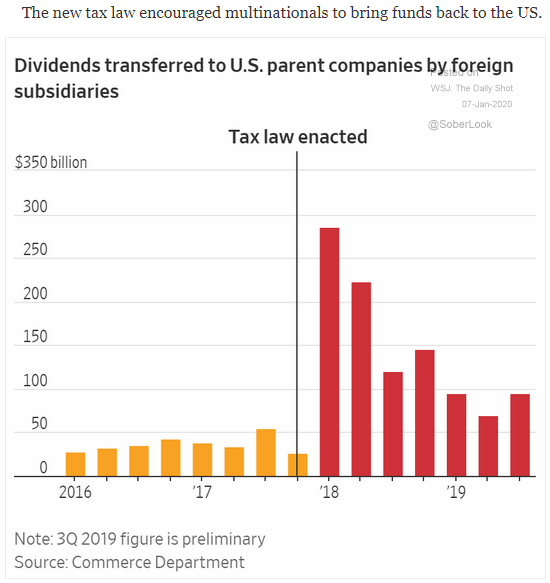
Fireside Charts: $1 Trillion Returned to U.S. After Tax Cuts, Buybacks Set Record, and USD Breaks Through Support
January 8, 2020U.S. companies have repatriated more than $1 trillion from foreign subsidiaries to their U.S. parents since 2017—more specifically, since the passing of the Tax Cuts and Jobs Act (TCJA). Unemployment has since seen record lows and consumer spending remains strong, despite ongoing weakness in manufacturing and trade. But companies quickly set another record ...
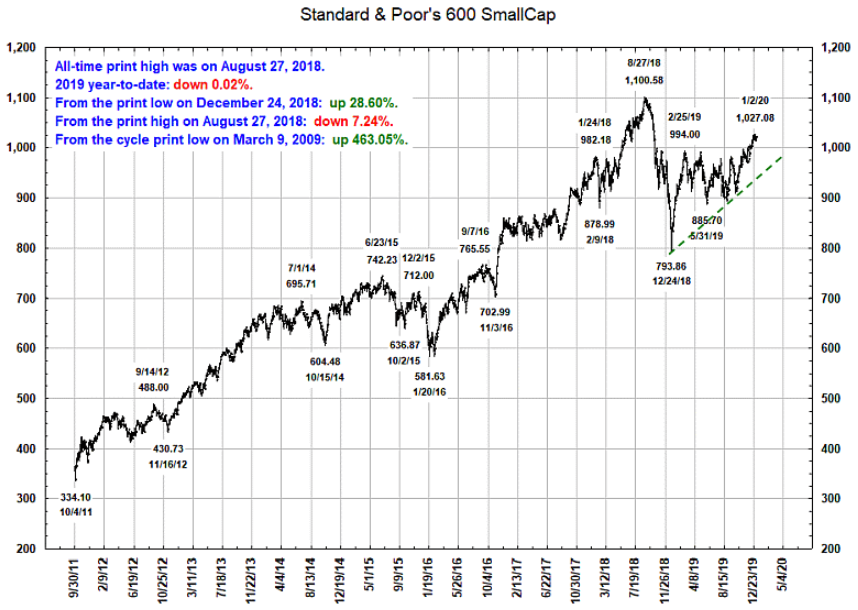
Fireside Charts: Small vs. Large Caps, Energy Prices Surge, and Manufacturing Sees Worst Activity in a Decade
January 6, 2020The S&P 500 hit another all-time high on Thursday and while the S&P 600 has risen over 460% since its financial-crisis lows, it—like many other markets—has yet to recapture its summer '18 magic and continues to trade below previous peaks. In comparison, its large-cap counterpart—the S&P 500—has continued setting records into 2020, leaving many wondering... could it be overheated? Mounting tensions in the Middle East could have something to say about the matter; brent crude futures shot past $70/bbl following ...
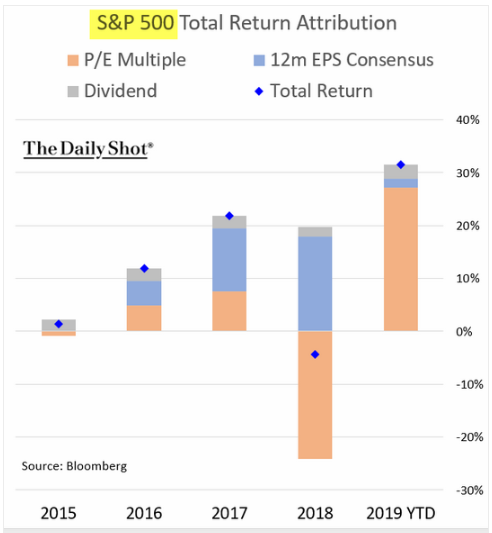
Fireside Charts: A New Performance Landmark, P/E Multiple Expansion to Thank for Record 2019, and Crude Oil Spikes After U.S. Airstrike
January 3, 2020Happy Friday, and welcome to the first Fireside Charts of the new decade! We're kicking off 2020 with a look at what made 2019 unique—for the first time ever, all major asset classes outperformed their historical averages. Also, after being a major drag on performance in 2018, multiple expansion accounted for nearly all (over 80%!) of the S&P 500's total return. Q3 earnings reports were full of pleasant surprises, but will it be enough to back up the higher P/E ratios in Q4 or was it simply a case of a low bar benefiting everyone? Meanwhile, much has been made of crude ...