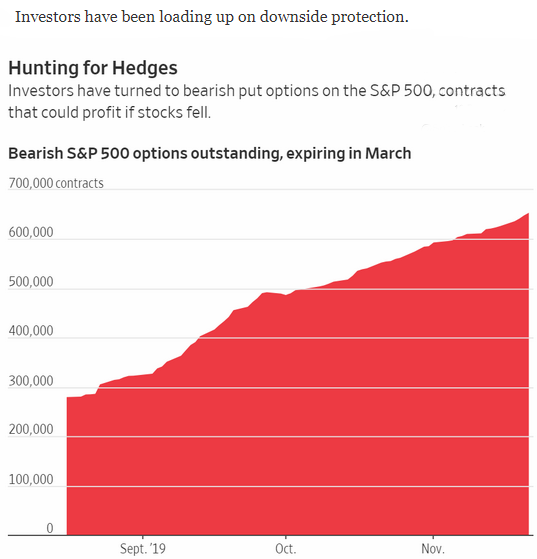
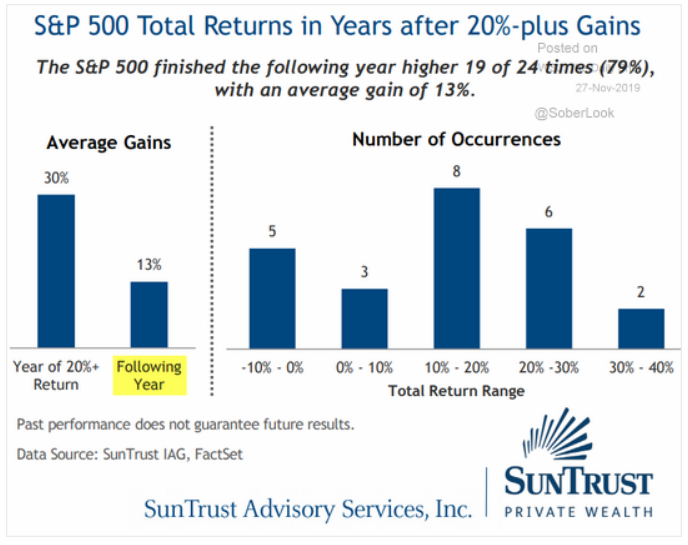
Fireside Charts: Bearish Puts Rise, CAPE Ratio Mirrors '29 & '00, and a Look at 'Dr. Copper'
December 20, 2019Happy Friday, Fireside Charts readers, and welcome to our final post of 2019! The S&P 500 hit yet another all-time high yesterday following additional positive trade war news out of Washington, but we're still seeing some mixed signals on market and economic health. Investors look to be bracing for a market turn and have been increasingly gathering expensive put options in a search for downside protection. And they could be on the right track as the CAPE ratio—a cyclically-adjusted P/E ratio that indicates if the market is over or undervalued—just climbed above 30 for the fourth ...
Fireside Charts: The Interim Trade Deal, ISM Manufacturing Data, and What Past Correlations Could Indicate for 2020
December 18, 2019While the markets have so far reacted positively to news of a phase one trade deal with China, a closer look at the details reveals some potential issues—particularly when it comes to the volume of agricultural exports. Meanwhile, FedEx shares were down ~7% in pre-market trading this morning following a 40% year-over-year drop in profits for fiscal Q2 and a surprising correlation between the company's performance and U.S. ISM Composite PMI is making us wonder what might be ...
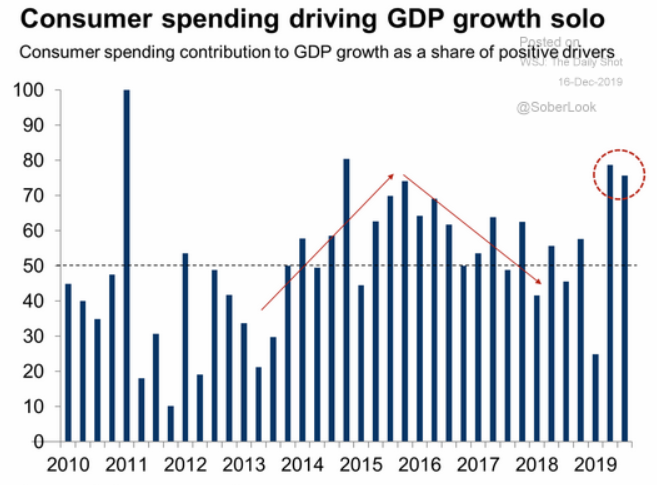
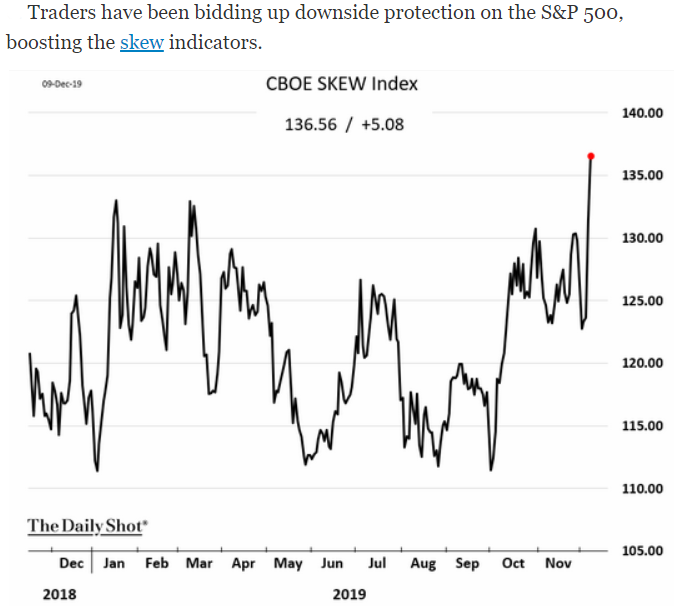
Fireside Charts: Consumers Still Driving GDP Growth, How the Sectors Stack Up, and SKEW Index Still Rising
December 16, 2019U.S. retail sales surprised to the downside in November, growing by only 0.2% and indicating a slow start to the holiday season. Could this spell trouble when consumer spending accounts for over 70% of GDP growth? And while the S&P 500 went on a record-setting spree in 2019 and seems determined to close out the decade on a high, the Communications Services and Energy sectors haven't quite followed suit. They've both enjoyed gains year-to-date but it's been years since they've done any record setting of their own. Meanwhile, the CBOE SKEW index continues to climb this week as ...
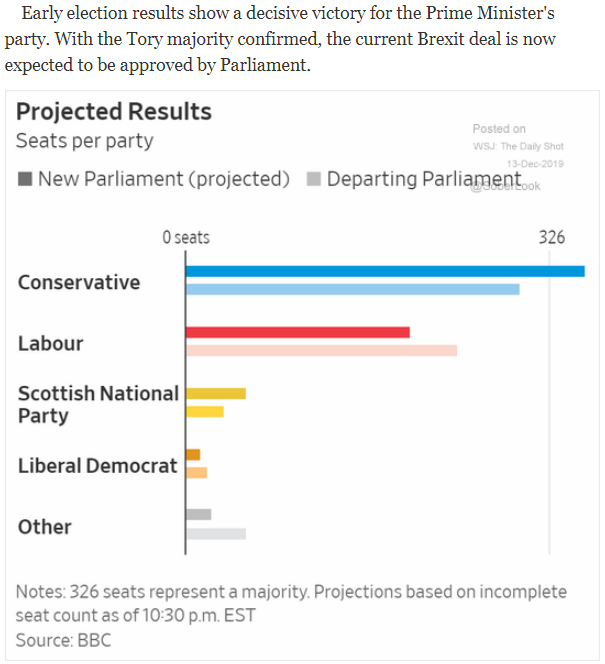
Fireside Charts: Trade War & BREXIT Headlines Spark Currency Action, and More Fed Intervention is on the Way
December 13, 2019While the superstitious among us may have been braced for bad news today (happy Friday the 13th!) the headlines—and market reactions—were largely positive. Two major drags on economic outlook, the trade war and BREXIT, both made progress yesterday as the U.S. and China struck an "interim" trade deal and Prime Minister Boris Johnson’s Tory Party won the U.K.'s general election, allaying fears of a "no-deal" BREXIT. The Nasdaq and S&P 500 hit record-high closes in reaction, and currencies also reacted strongly—but not necessarily in the USD's favor. The greenback's been dominating ...
Fireside Charts: Volatility "Microbursts" on the Rise, Key Risk Indicator Hits 2019 High, and Household Assets Set Record
December 11, 2019The U.S. political landscape isn't the only thing that grew more rocky in 2019; S&P 500 volatility and drawdown frequency have increased significantly in the last decade, with days spent with a 3%+ drawdown up almost fivefold over the early 2010's. Could this be part of the "mini-cycle" phenomenon we wrote about last month? And analysts may be seeing even more volatility approaching, as the CBOE SKEW Index—a measure of the perceived probability of outlier equity returns—has surged this month to a 2019 high. While ...
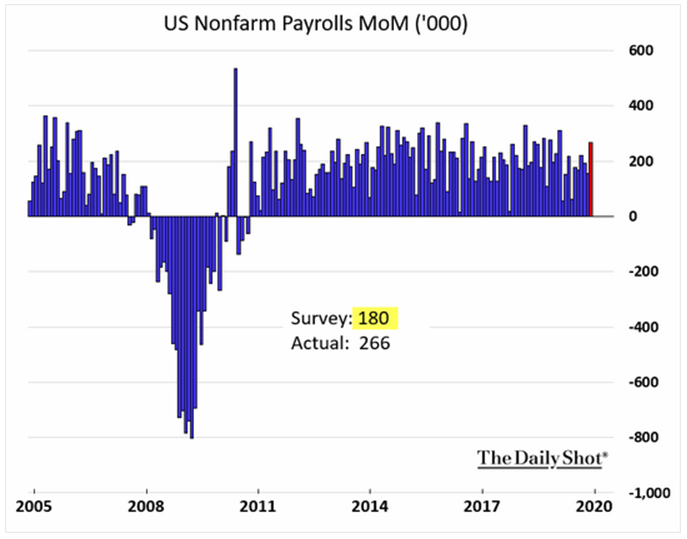
Fireside Charts: Private Payrolls Shock to the Upside, Unemployment Dips Back to Annual Low, and Strategists Measured on 2020
December 9, 2019Happy Monday, Fireside Charts readers! We mentioned the "rosy" outlook of Friday's jobs report last week, but let's take a minute today to stop and smell those roses. Private payrolls came in at more than double the expected figure and unemployment's revisiting its 2019 low—the third lowest since the 1940's—and wage growth has topped the mortgage rate for the first time in nearly 50 years. Not too shabby! It isn't all good news though, as extreme ...

Fireside Charts: Jobs Reports, Service Sector Slowdown, and Are We in a Large-Cap Super-Cycle?
December 6, 2019The Labor Department's jobs report was released this morning and it certainly paints a rosier picture than ADP's grim analysis from earlier this week (re: only 67,000 private sector jobs added in November—less than half of what was expected). With the Fed's recent adoption of the Sahm rule, we know how indicative employment numbers can be of oncoming recessions, but analysis can get tricky when you're looking at conflicting ...
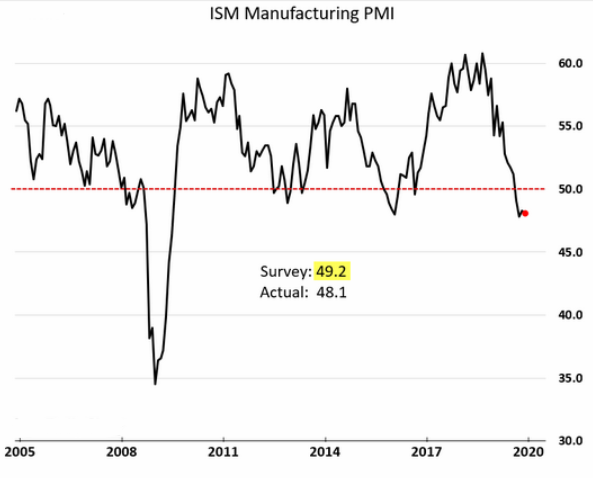
Fireside Charts: Manufacturing PMI Still Contracting, Corn Shipments Halved, and Non-OPEC Oil Supply Outpaces Demand
December 4, 2019Did you spend big this holiday weekend? While consumer sentiment and spending are still strong—Adobe Analytics estimates that sales topped $29 billion between Thanksgiving and Cyber Monday—strong consumer demand does not look to be trickling through to the manufacturing sector. Domestic and international markets continue in contraction and—despite a small recovery in Germany—a manufacturing recession has taken hold in all European nations except France and Eurozone Manufacturing ...
Fireside Charts: Financial Sector Breakout, Record Setting Trade Deficits, Underwhelming Regional Fed Reports
December 2, 2019We're back! We hope you all made it home safely from holiday travels and are not stuck in an airport or shoveling snow like a many of our colleagues. There's a lot to turn our attention to this week including today's testimony from the newly appointed ECB President, Christine Lagarde, in which she promised an "overarching review of ECB business ranging from how it defines its inflation objective to whether it includes a fight against climate change among its responsibilities." We'll see how her actions effect Europe's economy but most European stock indexes closed in the red today. ...
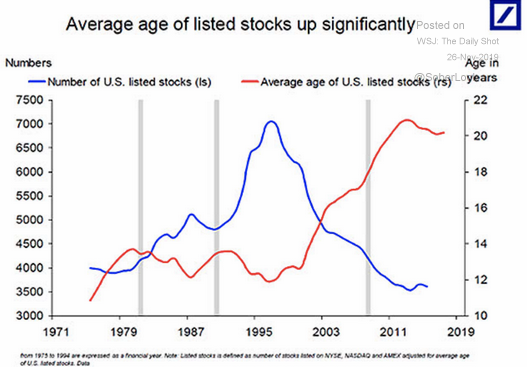
Fireside Charts: Trends in Stock Listings, Regional Fed Reports, and a Look at U.S. Energy Production
November 27, 2019Happy Thanksgiving Eve! We know you're anxious to get to your vacations, so we'll keep it to bullet points today: Despite numerous headlines on IPOs this year, the number of U.S. listed stocks has nearly halved in the past ~25 years. Is increasing variety of investment vehicles to thank? The Chicago Fed's National Activity Index (a weighted average of 85 existing monthly indicators of national economic activity) dipped further into negative territory this month, as did the Dallas Fed Manufacturing ...