Fireside Charts: Interest Rates, Credit Spread, and Millennium Nostalgia
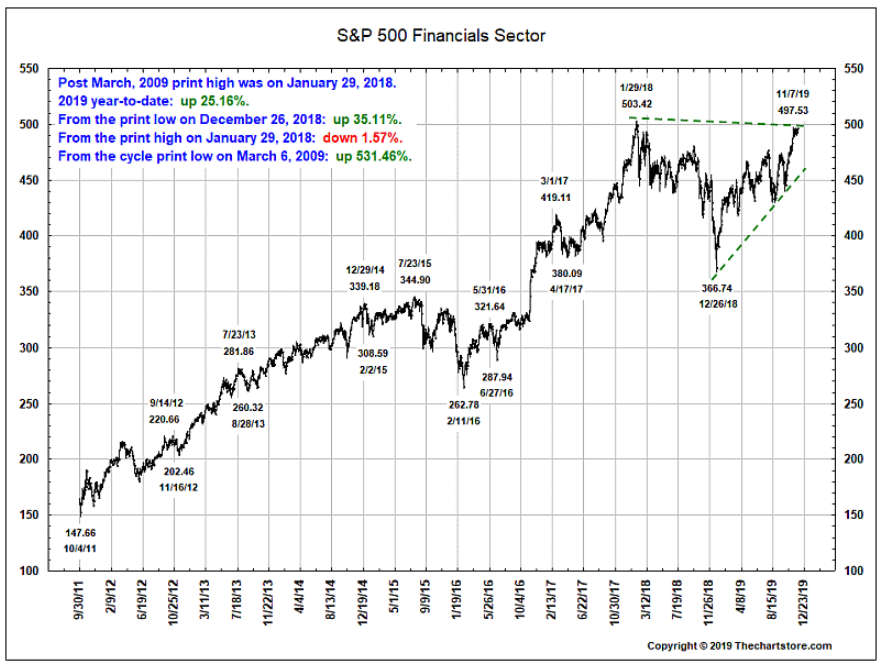
November 25, 2019Happy Thanksgiving week, Fireside Charts readers! The 10-year treasury yield hit a three-year low in early September (and has been lingering below 2% ever since) but a look back through 2012 has us wondering if it could be poised to rise. Meanwhile, the high-yield bond spread has already established some upward momentum as investors begin to demand more reward for taking on risk—can you guess how much the spread has jumped since the lows of 2017? And whose government-bond shopping spree could put black Friday to shame? Turning to sectors, while Energy is still disappointing, ...
Fireside Charts: Mini-Cycles, Manufacturing, and Mounting Debt
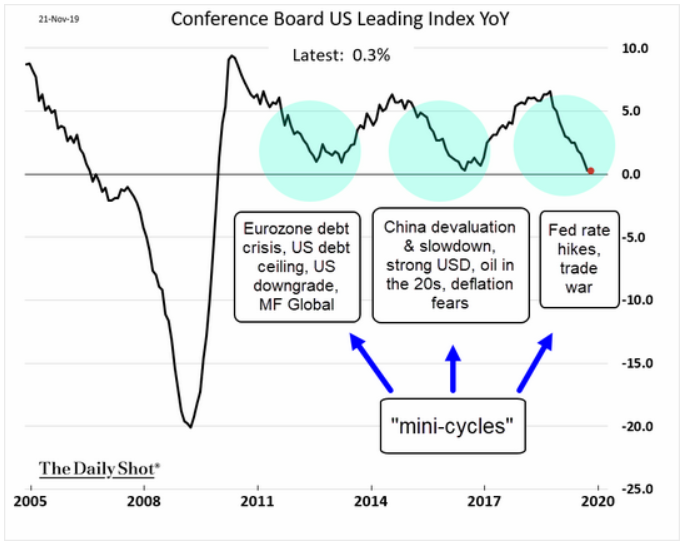
November 22, 2019The U.S. Leading Economic Index dropped for the third straight month in October, driven largely by investor uncertainty around the trade war, but a long-term view makes us wonder: are occasional hits to economic sentiment—and the "mini-cycles" they spur—a key to understanding how the current expansion has become the longest on record? Stay tuned as we keep our eyes trained to see if we're on the edge of another rebound or already in the midst of a more sustained downturn. In the meantime, we're seeing some mixed signals from the Philly Fed on manufacturing, and more evidence is piling up ...
Fireside Charts: 'De-Worsifying' Equities, U.S. Dividends Fail to Measure Up, and Are Junk Bond ETFs Turning to Junk?
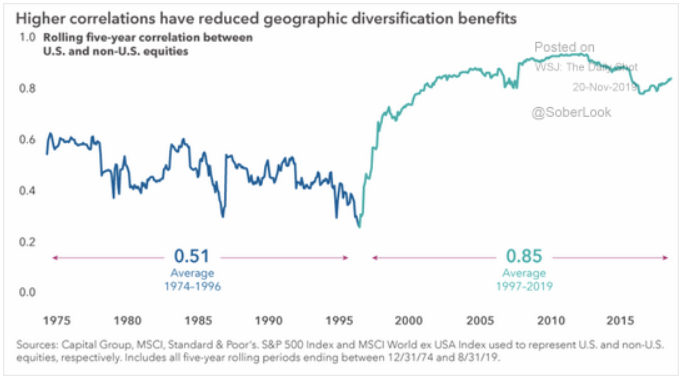
November 20, 2019Diversification has long been touted as a cornerstone of successful long-term investing, but do you know just how in-sync U.S. and international equities have become in the past 20 years? Here's a hint: if it was a letter grade, we wouldn't "B" dissatisfied. We are a little dissatisfied with how U.S. dividends stack up against those in international and emerging markets though. And are junk bond ETFs the next "big short?" Some investors seem to think so, but such heavy shorting has us wondering about the quality of the funds' holdings... and concerned about the retail investor ...
Fireside Charts: Empire State Manufacturing Disappoints, Easing Hits Decade High, and a Look at Government Spending
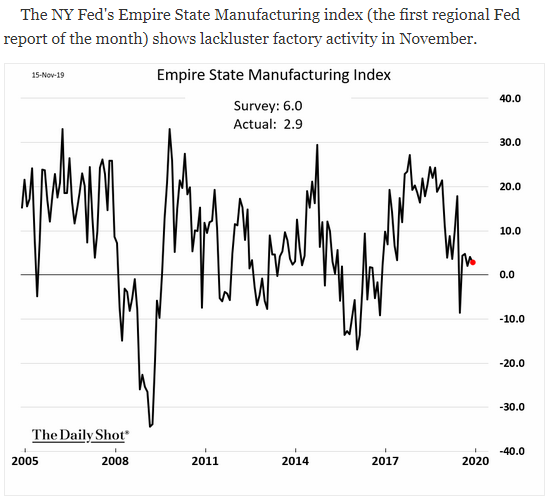
November 18, 2019The Empire State Manufacturing index turned in a sluggish 2.9 print on Friday, falling short of expectations and marking six straight months of soft numbers from the oft-prognostic index. With so many regions (both domestic and global) slowing though, it's worth noting that any reading above 0.0 indicates ongoing growth. Central bankers are almost certainly keeping their eyes on the trend and aiming to act quickly; the highest share of central banks in a decade are now engaged in easing and the Fed's balance sheet has skyrocketed in just two months. Quantitative tightening went on for ...
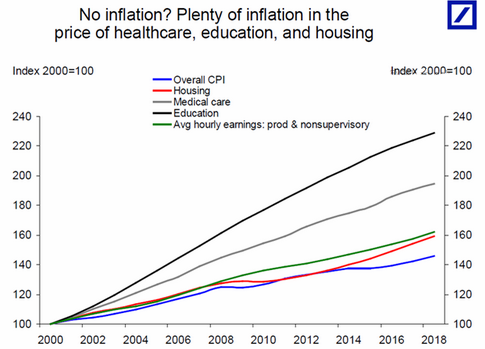
Fireside Charts: Inflation Takes Off (In Some Sectors), Earnings Season Rolls On, U.S. Crude Oil Production Sets Record High
November 15, 2019“Fed officials should go to the doctor if they think there is no inflation in the economy,” say Chris Rupkey, chief economist at MUFG in New York. Medical care, education, and housing costs are soaring—and significantly outpacing the rest of the market. Healthcare earnings surprised in more than one way in Q3 (see the details in the charts below)... could such aggressive pricing increases be to thank? Meanwhile, despite 70%+ of companies beating earnings estimates as of last week, EPS growth rates have established some downward momentum in the last year. While record performance from ...
Fireside Charts: Small Caps Lag, Farm Debt Set to Reach Record High, Investment Indicators Down in Leading Economies
November 13, 2019The S&P 500 has surged over 20% and set 16+ record closes this year, but small-cap stocks have failed to follow the same pattern, and appear to be bearing the brunt of rising political, trade, and economic uncertainty. Will they continue to linger under 1600.00? The U.S. farmer is shouldering the same burden, as farm debt is projected to reach record highs this year following a 24% YoY September surge in bankruptcies. And leading economies ...
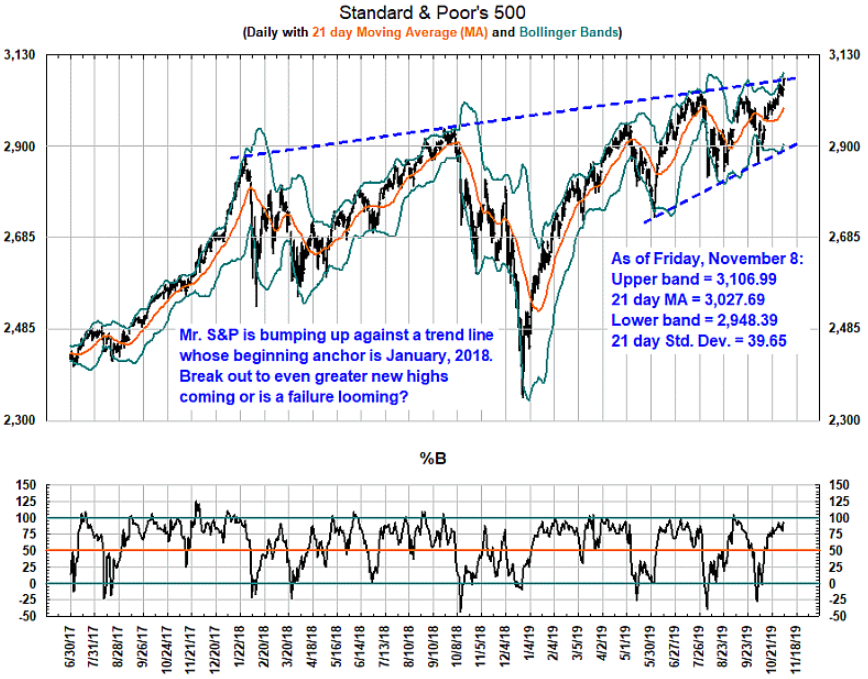
Fireside Charts: S&P 500 Tests Trend Lines, Inflation Rises in China, and Steel & Aluminum PMI Send Positive Signs on Manufacturing
November 11, 2019Happy Veteran's Day, Fireside Charts readers! Out of respect for the holiday, the bond market is closed and no new economic reports are due out today, but even on a holiday Monday, analysts are likely keeping their eyes peeled for more U.S./China trade news. While hopes surged Thursday for an approaching deal, President Trump reiterated his rejection of the claims over the weekend, stating that the tariff reduction story was "over reported." The S&P 500 backed off its recent all-time highs in response to the confusion, and now we're left wondering if it may soon be pushed out (one way ...
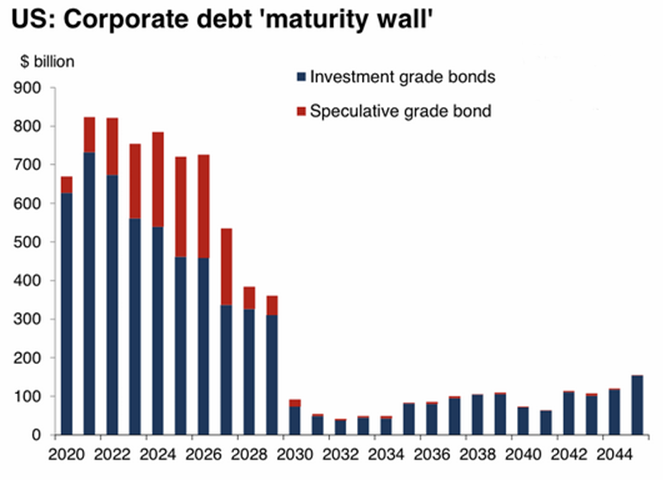
Fireside Charts: U.S. Companies Face Wave of Maturing Debt, The Trade War is Benefiting Brazilian Soybean Farmers, and a Look at Aramco's Valuation
November 8, 2019News on earnings has been largely popular thus far as many companies continue to outperform expectations, but it isn't all good news for corporate America; $4 trillion of maturing debt is coming due over the next five years, and the historically low interest rate environment only complicates the picture. If economic growth slows further, as it is projected to do, and rates rise, both the companies themselves and fixed-income investors may be in for a bumpy ride. And though optimism around reaching a phase one trade deal—particularly following China's announcement yesterday that an ...
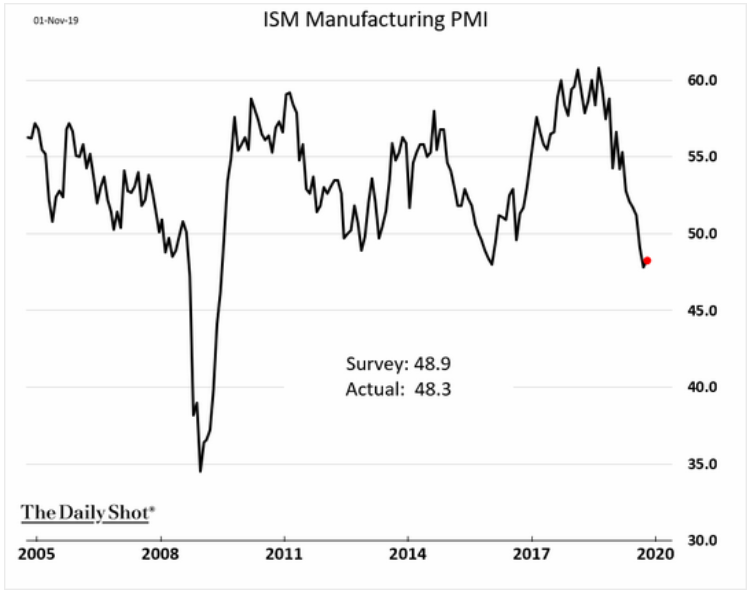
Fireside Charts: Q4 U.S. GDP Estimates Revised Lower Amid Sluggish Inflation & Manufacturing Prints, Conflicting Reports Emerge on China
November 6, 2019While Q3 GDP growth surprised at 1.9%, the New York and Atlanta Feds' projections for Q4 see levels dropping to 1%. Slowing growth, the inverted yield curve, and ongoing trade woes have many worrying about an approaching recession, but a look at the charts shows that select advanced economies have historically been able to withstand global downturns. While wage inflation has finally ticked up and overall inflation—though slowing—is relatively in-line with expectations, the ongoing domestic (and global) manufacturing contraction continues to weigh on the U.S.'s efforts to sustain this ...
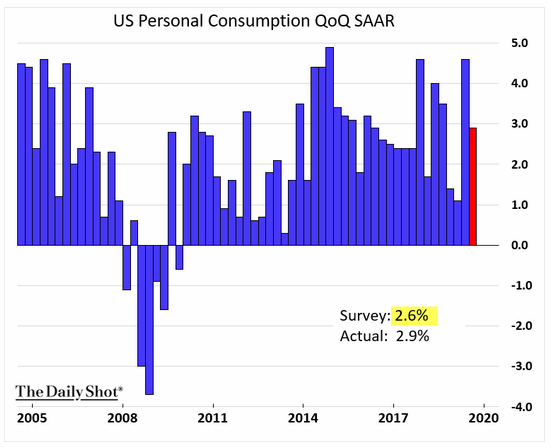
Fireside Charts: A Closer Look at Last Week's GDP and Jobs Reports
November 4, 2019The S&P closed at another all-time high on Friday (that's three new records set in a single week, by the way), thanks in large part to last week's surprise GDP and jobs reports. Today, we take a closer look at the details: Consumer spending is still the primary driver of the current expansion, and surpassed expectations despite a >1% decline from Q2. Business investment's contribution has been ...