Fireside Charts: Fed Issues Emergency Rate Cut, S&P 500 Historical Trends, and a Global Manufacturing Pulse Check
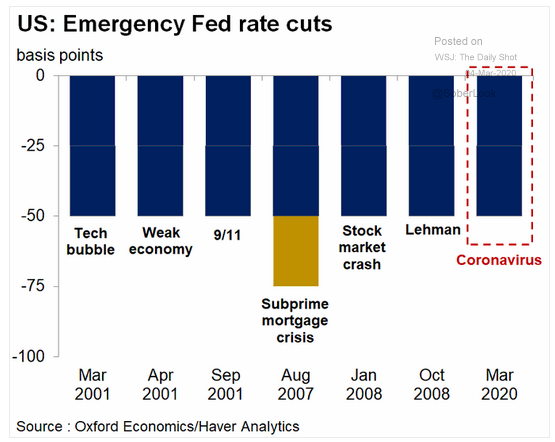
March 4, 2020In a surprise (and rare—this marks the first since the financial crisis) inter-meeting move, the Federal Reserve issued an emergency 50-basis point rate cut yesterday to help ...
Recent Repo Market Fiasco and Intervention
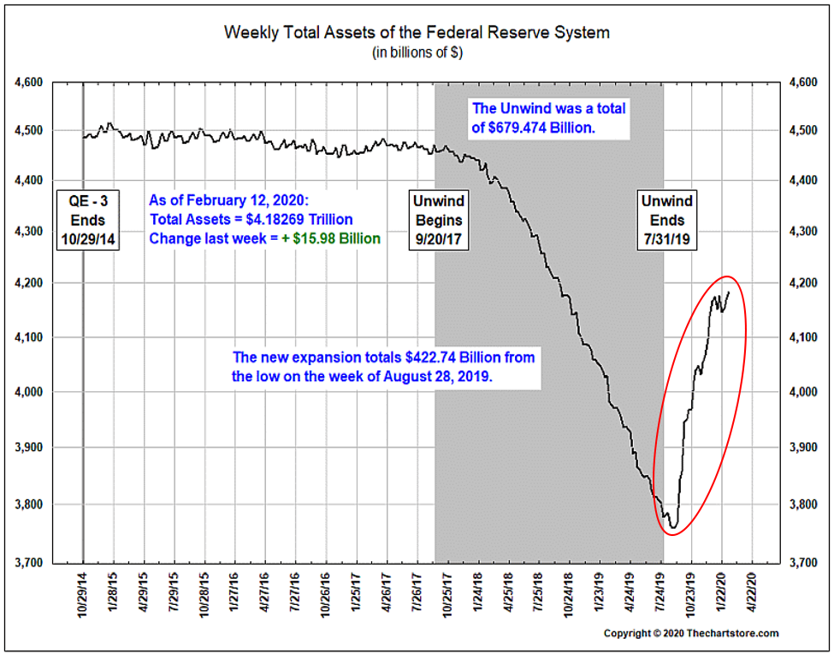
March 3, 2020Recently a reader asked us to explain “the recent Repo Market Fiasco and the Fed’s intervention,” as well as the consequences and outcomes. For those of you who regularly read our blog, we first included a chart on this subject on September 23, 2019. The answer is fairly technical, but let’s focus on some charts to show the enormity of the issue first.

Fireside Charts: More Record Lows, Central Bank Intervention, and is the Market Oversold?
March 2, 2020After a straight week of market losses, there were some signs of stabilization this morning—the question is whether it will last or amount to a head-fake. The S&P ...
Fireside Charts: Fastest Correction on Record for S&P 500, U.S. Outperformance Shrinks, Safety Assets Surge
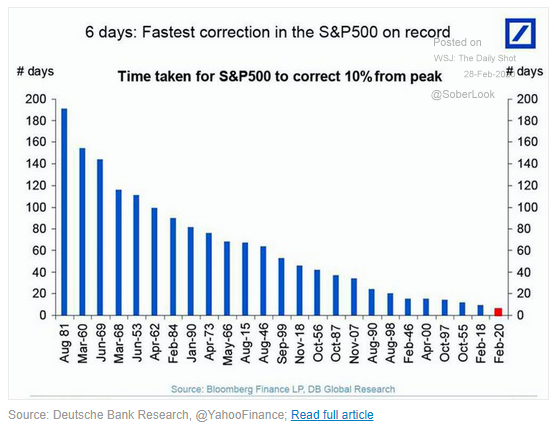
February 28, 2020It's no secret: this has been the worst week for U.S. stocks since the financial crisis. U.S. indices have entered correction territory—the fastest correction on record for the ...
From the Desk of the PM - Update on Market Selloff and and Coronavirus Fears
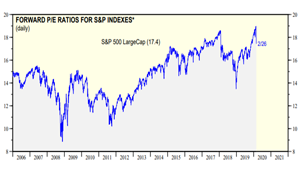
February 27, 2020With the sudden drop in the global equity markets, we thought it might be helpful to remind everyone about where we have been, where we are now, and share some helpful source information. Before we discuss the virus, let’s go back and remind everyone that U.S. large cap stocks, after demonstrating a decade of leadership, may have gotten ahead of themselves from a valuation standpoint. As the chart below from Ed Yardeni Research shows, the forward P/E of the S&P 500 reached 19X—which is a level not seen since the Dot.com bubble in the late 1990’s—and, depending on ...
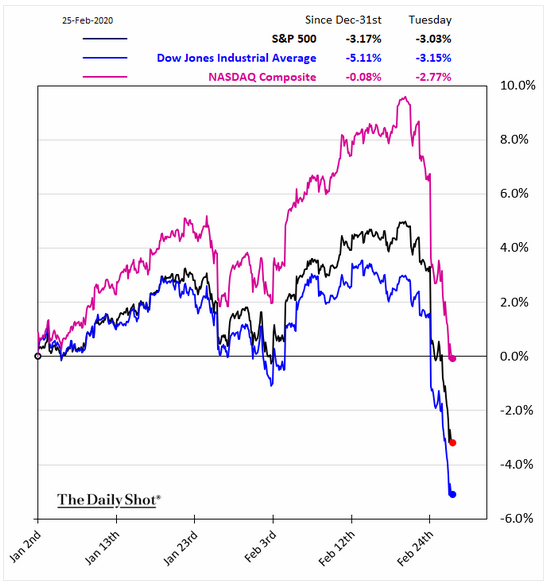
Fireside Charts: Analyzing the Sell-Off, 10-Year UST Hits All-Time Low, Coronavirus Spreads Outside of China
February 26, 2020The markets may have kicked off this week with a severe case of the Mondays (okay, and the Tuesdays...), but is the situation as bad as it's being made out to be? The ACWI's ...

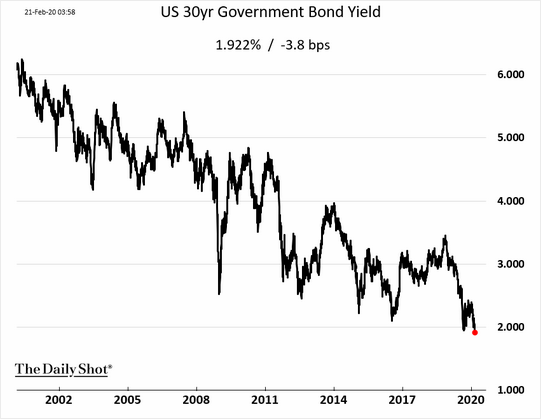
Fireside Charts: S&P 500 Forward P/E Ratio Passes 19%, U.S. Manufacturing Reverses Trend, Yields Hit Record Lows
February 24, 2020The forward price-to-equity (P/E) ratio for the S&P 500 index was about 19.5 late last week, passing the 19% ...
Fireside Charts: Energy Sector Runs Out of Steam, Tanking Business Activity in China, Yield Curve Inverts Again
February 21, 2020While the S&P 500 has remained fairly "energized" throughout recent periods of geopolitical and epidemiological uncertainty, the index's energy sector has failed to live up ...
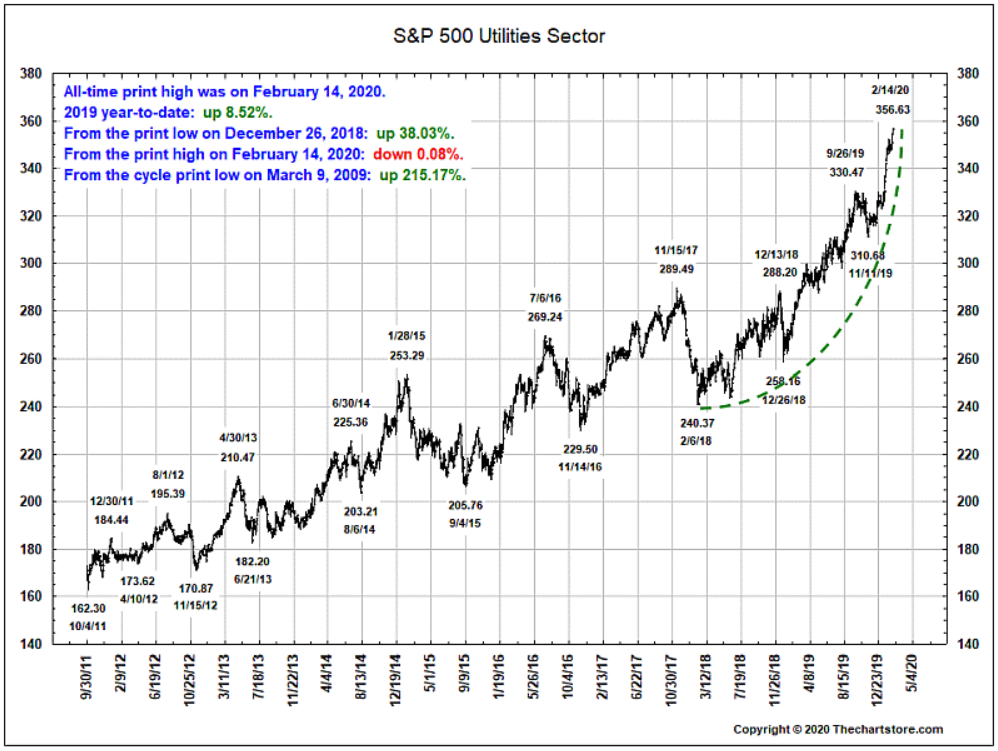
Fireside Charts: The S&P 500's Value Concentration, Utilities Hit Record High, and a Look at Bond Market Signals
February 19, 2020The S&P 500 had a record year in 2019 and may still be hovering around all-time highs, but it looks like (when it comes to 4Q19 earnings per share growth, at least) credit is ...

Fireside Charts: Farm Bankruptcies Hit 8-Year High, Coronavirus Confusion, and Slowing Growth
February 14, 2020Happy Valentine's Day, Fireside Charts readers! If your wallet's feeling a little light this week, you aren't alone; U.S. farm bankruptcies keep climbing and hit an eight-year ...